The Marquette Law School released results of state and national rounds of polling over the past two weeks. The toplines are of interest, but as is often the case, a look at the crosstabs provides a deeper perspective. Here we take a slightly deeper dive into these releases, comparing results between subgroups of respondents in both the national and state results. Some of these comparisons tell a different story than the toplines from the full survey group.
A Majority of National Voters say:
- Neither Presidential Frontrunner Inspires Confidence
- Support for 2nd Amendment Rights is Broad
- Race Should Not be a Factor in College Admissions
- U.S. Should Support Israel
Voters Skeptical of Presidential Frontrunners
Voters were asked which presidential frontrunner (Biden or Trump) would better handle a list of issues illuminated what’s likely to be a problem both parties have with the voters’ view of candidate competence.
The only categories where either candidate reached 50% on their ability to handle any polled issue well were Immigration (Trump 50%) and the economy (Trump 51%). Roughly a quarter of voters think both would be the same or neither good on abortion, climate change, Medicare and Security and Israel.
The low level of voter confidence likely means two things for the campaign cycle. First, campaigns will need to spend more money turning out voters who are obviously skeptical about their options. Second, there will be plenty of negative ads to drive down belief in the competence of their opponent.
Issues Which Have Majority Agreement
Even when a poll shows the majority of respondents share a view sometimes, but not always, there are fairly substantial differences among subgroups. Two of the topline responses tend to align with conservative views and the others with more liberal views, and looking into age and gender differences tell us some expected and unexpected things.
The ban on the use of race in college admissions is strongly favored by 57% of voters overall – the support ranges from high of 64% among those 60 and older to 48% in the 30-44 age group.
Some 68% of voters strongly or somewhat support the Supreme Court ruling affirming the right to use handguns for self-defense. On this question, there is some variation by age – those 60+ have the highest intensity of support (46% strongly support) while the 18-29 group has the least intensity (26%) but when overall support is measured, the younger group has higher support (65%) than the older group (62%).
Workplace protection for gay and transgender workers are strongly supported by 55% – support that is consistent across age groups.
On the question of support for overturning Roe vs Wade, 66% oppose with 47% strongly opposing. These levels hold across all age groups.
Nearly three-quarters (72%) consider racism a moderately big or very big problem in the U.S. today. Those 60+ have the highest intensity with 40% saying it is a very big problem. There’s a fairly large gender gap with 45% of women saying it’s a very big problem, but only 29% of men.
Support for Israel in War with Hamas by Age and Race/Ethnicity
Looking a bit deeper into results reveals much more, and that’s particularly true regarding the Israel/Hamas war in the national poll.
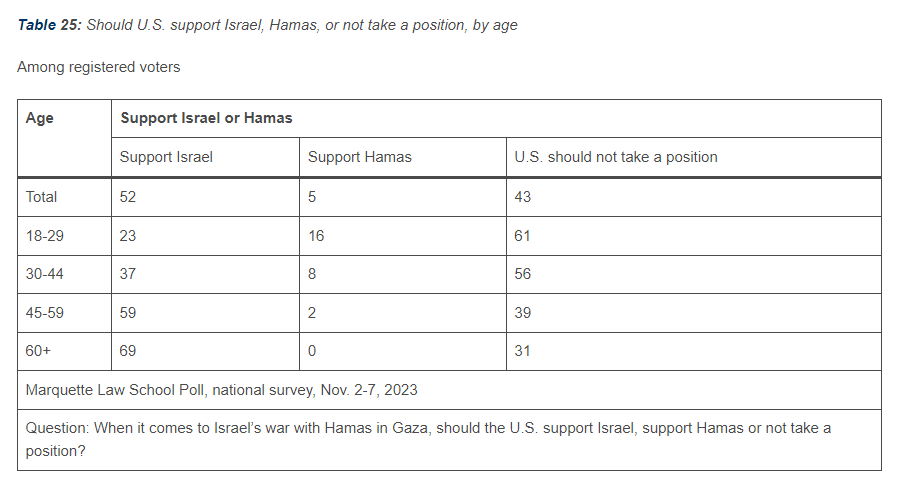
Overall 52% believe that the U.S. should support Israel, 43% believe the U.S. should take no position, and 5% say we should support Hamas. But the poll showed a wide divide between age groups on the issue of whether the U.S. should support Israel or Hamas in the current conflict.
- 69% of those over 60 believe the U.S. should support Israel, 0% would support Hamas.
- In the 18-29 age group, only 23% favor support of Israel while 16% favor supporting Hamas.
- 61% of the younger group would prefer the U.S. take no position.
- 31% of the older group feels the same.
Other demographics with the highest levels of support for Hamas:
- 14% of black voters want the U.S. to support Hamas.
- 11% of strong Democrats want the U.S to support Hamas.
Younger Americans Know Little About the Holocaust
This difference between age groups is perhaps not surprising given the beliefs and knowledge about the holocaust found among young Americans in a 2020 survey. In that survey, 18–39-year-old Americans held the following beliefs/disbeliefs about the Holocaust:
- Almost two-thirds (63%) didn’t know 6 million Jews were killed.
- 11% said the Jews caused it – 19% in New York.
- 1 in 8 said they hadn’t heard the word Holocaust.
- 48% could not name a single concentration camp.
Young people in Wisconsin were better-informed than other states, but still woefully undereducated. Yet back in 2021, DPI refused to take a position in favor of the bill (later signed into law) mandating holocaust education in schools, saying the word holocaust is mentioned, once, in recommended but optional standards for social studies education. Standards that were obviously falling well short.
Anne Frank’s White Privilege
All this must surely be a blow to the hearts of the roughly 150,000 veterans if WWII still living in the U.S. More painful yet might be the argument on social media about the life and death of Anne Frank being propaganda and ignored the genocide of girls of other races, and the Palestinian girls being killed by Israel. (‘Becky’ is a pejorative term for a young white woman who is ignorant of her privilege and prejudice according to Merriam-Webster.)
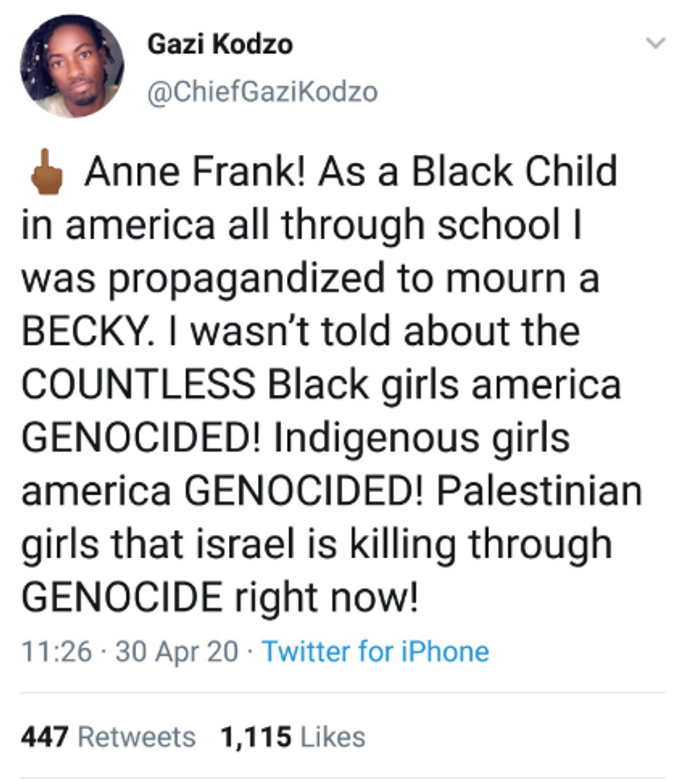
Kodzo (also known as August Romain, a former BLM figure and head of the African People’s Socialist Party) at least had been taught about Anne Frank, if not English, in school.
Last summer (two years later) Twitter was again aflame with a debate about whether Anne Frank, murdered through government-sanctioned racism, had ‘white privilege.’ These narratives, in these social media streams, are obviously helping shape the polling results we are seeing among younger voters.
Proper Level of Support for Israel
This weekend democrats condemned a neo-Nazi demonstration in Madison as antisemitic. But they’ve said little to nothing about the antisemitic, pro-Hamas protests on campuses, in Milwaukee and at the Capitol; perhaps they understand the demographic and political underpinnings of the shrinking support for Jews and Israel across the nation.
The partisan and racial/ethnic breakdown on the recent national Marquette Poll question about the level of support the U.S. is giving Israel is also notable. Overall 28% of voters said the U.S. was providing too much support to Israel, while 23% said we are not providing enough support, with half of voters saying the amount of support is about right or they did not know.
By racial and ethnic background, Hispanic voters are most likely (40%) to say the U.S. is giving too much support. By party affiliation, Independent voters are more likely to believe (40%) the U.S. is giving Israel too much support.
The lack of education about and understanding of, the Holocaust among younger voters coupled with the view that Jews are part of the white-supremacist-privileged-oppressor class signals, evidenced by the pro-Palestinian/pro-Hamas protests on college campuses and elsewhere, suggests the U.S. on the cusp of a sea change in terms of our relationship with Israel.
Moving on to the Wisconsin survey…
A Majority of Wisconsin Voters say:
- Wisconsin is on the Wrong Track
- Supreme Court Should Keep Legislative Maps in Place
- Judicial Candidates Should Campaign on Issues
On the Wrong Track
A 62% majority of voters say the state is on the wrong track. This is typically an indicator of a mood among the electorate that has negative implications for incumbents running in an upcoming election cycle.
Often right track-wrong track numbers tracking relatively closely with opinion on the economy – the worse voters think the economy is, the higher the wrong track numbers. In the October Wisconsin poll, this relationship holds largely true across age groups – except the youngest.
In the 18-29 age group, 83% see the economy as either not good or poor, but 52% also say the state is on the right track. This large discrepancy suggests that Gen Z voters are giving much heavier weight to non-economic issues in their view of how things are going.
Keep the Maps
The state Supreme Court is poised to redraw legislative maps, something a slim majority of voters opposes. Coupled with the wrong track numbers and the 40% approval rating of the legislature, upending the maps – putting incumbent legislators in districts where voters don’t know them – could have unanticipated fallout. Voters may not attach all the negatives of incumbency to a legislator they don’t know and who is new to representing them. That might be a small help to sitting legislators in an anti-incumbent atmosphere.
The youngest voters are far more supportive of the Supreme Court redrawing legislative maps before 2024 election. While a (relatively slim) majority of every other age group prefers to see the old maps stay in place, 58% of voters 18-29 want to see the maps overturned.
Activist Judges
This poll reinforces something we’ve written about before: voters are no longer looking for impartiality as the most important qualification for judicial candidates. An overwhelming majority of voters (80%) want to know where candidates for judicial seats stand on issues. Support for campaigning on issues is higher among younger voters, reaching 86% among the youngest voters.
This shift to voters preferring to elect activist judges who will decide issues based on ideology will have long-lasting, long-range impacts on government, and our rights. It’s also a change that candidates in judicial will have to factor in to their campaign strategy.
Age Matters – Wisconsin
Often campaign organizations are basing strategy on outdated and unexamined notions of how age groups view issues and vote. As we’ve written, strategists have failed to consider the fastest growing and highest propensity voters. It may be because they fail to even recognize seniors as the largest and most powerful group of voters.
Instead, there’s been a heightened focus on young voters for a number of past cycles. Much excuse-making on the Republican side about high profile losses in Wisconsin’s 2022 midterm centered on an increase in voting by younger voters, particularly on campuses, compared to the 2018 midterm. Nobody mentioned the 5% decrease in proportion of the 65 and over age group that turned out to vote, which almost surely had more impact.
It is undeniably important to reach out to younger voters in planning for the future, but understanding demographics and voting behaviors must factor into strategy. It’s equally undeniable that older voters warrant more attention as a much larger group with much higher turnout rates. This is all the more true since the senior population will continue to represent a larger proportion of the population, and there was an overall decrease in the U.S. population under 25 over the next decade.
In Wisconsin, the population 34 and under decreased by 3% between 2010 and 2022, while the population over 65 increased 5%.
| Wisconsin Population Age Groups | 18-24 | 65+ |
| Percent of total population 2023 | 9.5% | 19% |
| Percent of registered voters 2023 | 9% | 29% |
| Percent of group voting in Nov 2022 midterm | 49% | 71% |
| Percent of group voting in Nov 2020 presidential | 56% | 82% |
| Percent of group voting in Nov 2018 midterm | 48% | 76% |
While these age ranges don’t match up with the age ranges used by the Marquette poll, a reasonable estimate of the 18-29 group might be roughly a half-million registered voters, and the 60+ group perhaps 1.3 million. That would make the 18-29 age group about 14% of voters and the 60+ group 37%, a shift toward the younger cohort, but the comparative size and voting impact heavily weighted toward the older group.
In the late October Marquette Wisconsin poll, a strong majority 57% of 18–29-year-old voters say they are very or somewhat enthusiastic about voting in 2024. But a larger majority, 58%, of the 60+ group is very enthusiastic, and another 23% somewhat enthusiastic. That means the enthusiasm gap is 24% – in favor of the older voters who voted at a rate 26% higher than younger voters in the last presidential election.
Meanwhile 71% of the 18-29 group said they were certain to vote in November 2024, compared to a much larger 88% of the 60+ group. It’s clear that a path to victory must go through this older demographic.
A New Old Story
Although Wisconsin has a larger elderly population, and always high overall voter turnout, this is a national phenomena. Turnout rates go up with age – as seen in this chart below from Brookings. 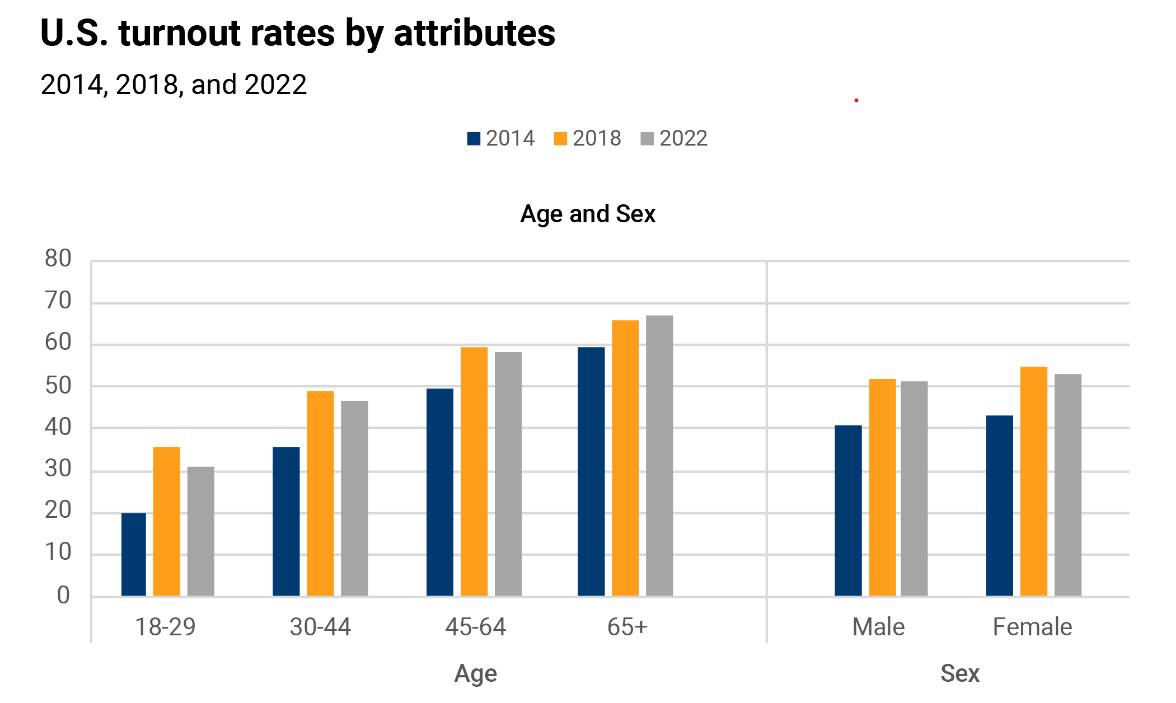
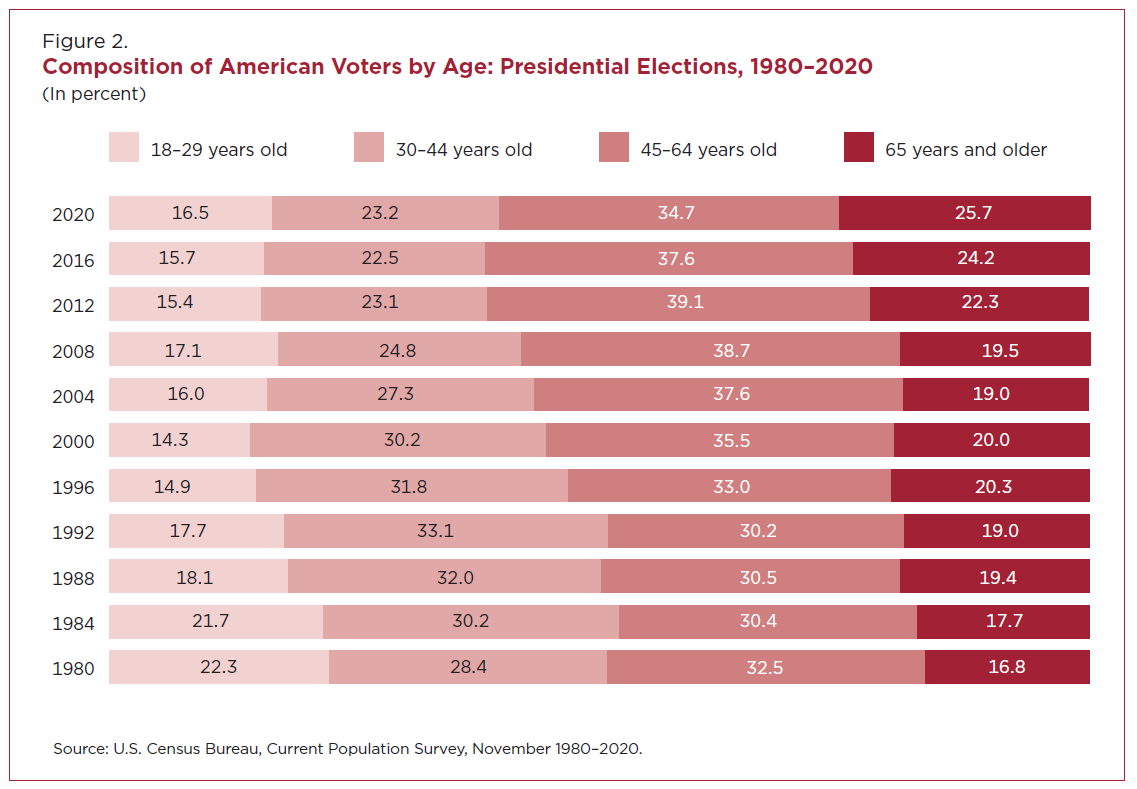
And this chart from the U.S. Census Bureau shows the composition of voters by age over time. Higher voter propensity in a growing demographic group – now over 25% of the voting public – gives them outsize impact, and candidates who understand these factors – and the issues this group cares about – may find more success.