
July 30, 2021
By Bill Osmulski
The MacIver Institute set out to answer a simple question. Does COVID-19 activity decrease as vaccination rates increase?
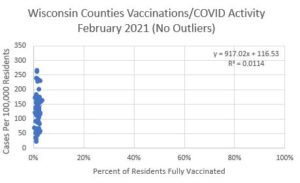
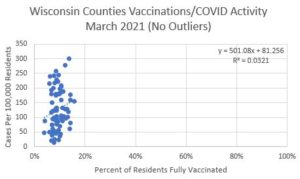
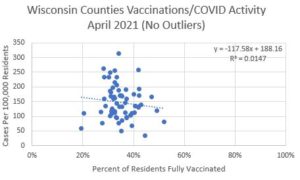
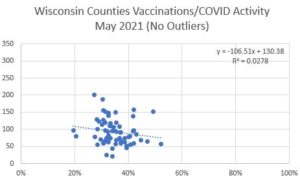
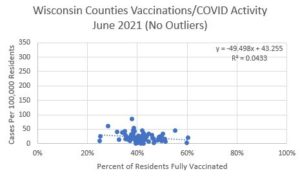
To answer this question, we gathered data from all 72 Wisconsin counties from February through June of 2021. We then compared the percentage of residents fully vaccinated on the first of each month and the COVID-19 activity level per 100,000 residents approximately two weeks later. It’s supposed to take two weeks for the vaccine to take effect. All the data came from the Wisconsin Department of Health Services.
We arranged the data on a series of scatter plots to conduct an initial visual analysis. Each dot represents one county at a fixed point in time. None of the charts seemed to display a linear relationship. The residuals also suggested no relationship. Finally, the correlation coefficients showed no correlation.
For there to be a correlation between two sets of data, the correlation coefficient (r-value) should be close to 1 or -1. The closer it is to zero, the weaker the correlation. The average r-value was -0.05.
The r-value is typically squared when working with linear regressions, as we are in this study. The r2-value ranges between 0 and 1. The closer it is to 1, the stronger the correlation. The closer it is to zero, the weaker the correlation. The average r2-value was 0.04.
Based on this evidence, we determined there was no correlation between vaccination rates and COVID-19 activity level.
We also considered potential lurking variables that could affect the data. First, we calculated and removed outliers. That produced similar results. That gave an average r-value of -0.07 and an average r2-value of 0.03.
We then considered the effect population density could have on the results. Using the most recent month’s data (June), we grouped counties according to their 2021 population density. One group included population densities from 0 – 25 individuals per square mile. The second group included counties between 25 and 100 individuals per square mile. The last group included counties with a population density above 100 individuals per square mile.
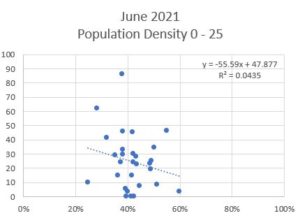
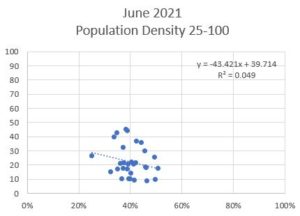
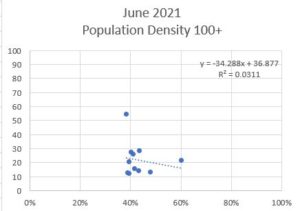
Again, there was no correlation between vaccination rates and COVID-19 activity level. For counties with a population density less than 25 individuals per square mile, the r-value was -0.22 and the r2-value was 0.04. For counties with a population density between 25 and 100 individuals per square mile, the r-value was -0.22 and the r2-value was 0.05. For counties with a population density more than 100 individuals per square mile, the r-value was -0.18 and the r2-value was 0.03.
None of the charts produced an r2-value higher than .049.
This simple study does not prove that vaccinations do not impact disease activity levels. However, it does show there is no correlation between the two. Public policymakers should consider that conclusion as they make future public health decisions.
Finally, it should be noted that for all counties, regardless of vaccination rates, the COVID-19 activity level dropped below 100 cases per 100,000 residents in June. This was the lowest rate of the year at that point.