Back-to-school season is here, and it’s time to hit the books. Catch up on remedial education, AP score analysis, and all the rest you won’t see anywhere else.
September 4, 2018
A MacIver Analysis by Ola Lisowski
Welcome back, everyone! It’s the first day of school for most kids across the state, which means it is time for MacIver’s annual look at the state of education in Wisconsin and how our children are faring.
One of the most encouraging trends in Wisconsin education is AP Exam participation. The number of AP Exams taken by students has increased by a stunning 56 percent since 2011.
In 2018, there are many—and we mean many—ways to track student achievement. There are, of course, other important issues to address as well, such as school choice participation and remedial class enrollment.
At the MacIver Institute, we always work to give our readers an unvarnished look at education. Much of this data— especially that on remedial education—is information you won’t see elsewhere. We believe that in order to make real progress on the state of education, you simply can’t sugarcoat the tough issues. Let’s dive in.
The Metrics: Student Performance
Every year, the Department of Public Instruction (DPI) releases a slew of data measuring the performance of our schools in Wisconsin. The federal government and test-makers like the ACT also regularly release data. Let’s start with the newest-available data for this year.
ACT Scores
So far, the most significant data release of 2018 came in early March.
That data drop focused on the class of 2017, including ACT results. The ACT is a national, standardized exam that students use for college applications. The data show that Wisconsin’s class of 2017 scored an average of 20.3 out of 36 points on the ACT exam.
Compared to the class of 2016, test scores remained exactly the same for the overall composite score, as well as the subject areas of English, math, and writing. With 92.1 percent of public school students taking the ACT, participation also stayed the same compared to 2016.
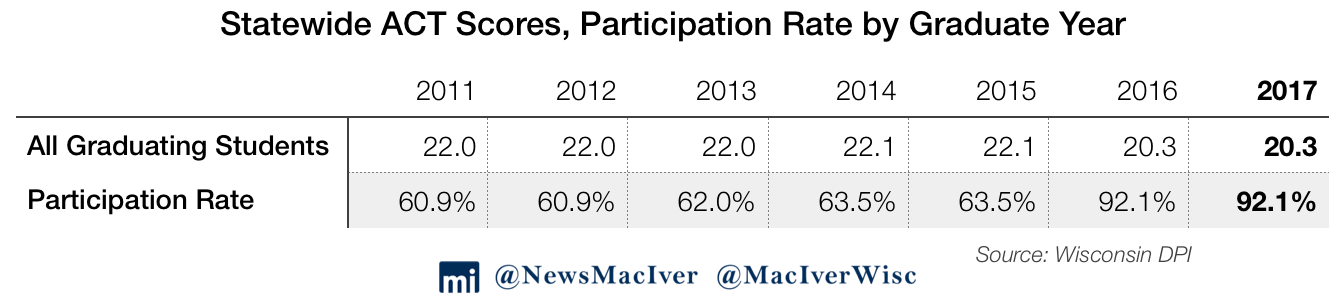
Wisconsin is one of several states which pays for all high school juniors to take the ACT exam. 2016 was the first year the state did so, bringing a massive jump in participation. This particular data represent the average of all ACT exams taken by 2017 graduates, not just the exam taken their junior year.
Scores remained flat compared to the prior year in every subject area except reading, where the average score fell from 20.5 to 20.4. However, the percent of college-ready exam takers grew to 40.5 percent from 39.6 percent.
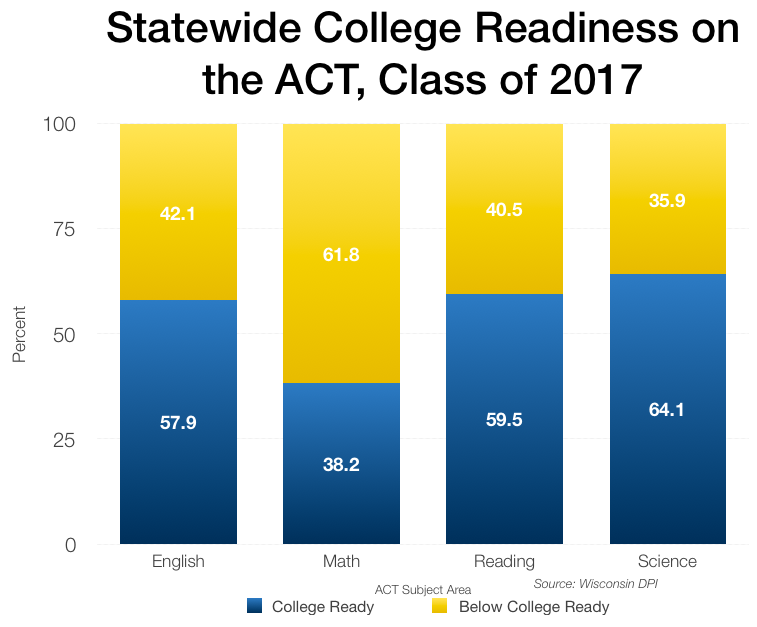 In English, students earned an average of 19.4 out of 36 points, while the percentage of college-ready students fell to 57.9 percent from 59 percent. In math, the class of 2017 scored an average of 20.3 points, and college readiness fell from 40.1 percent to 38.2 percent.
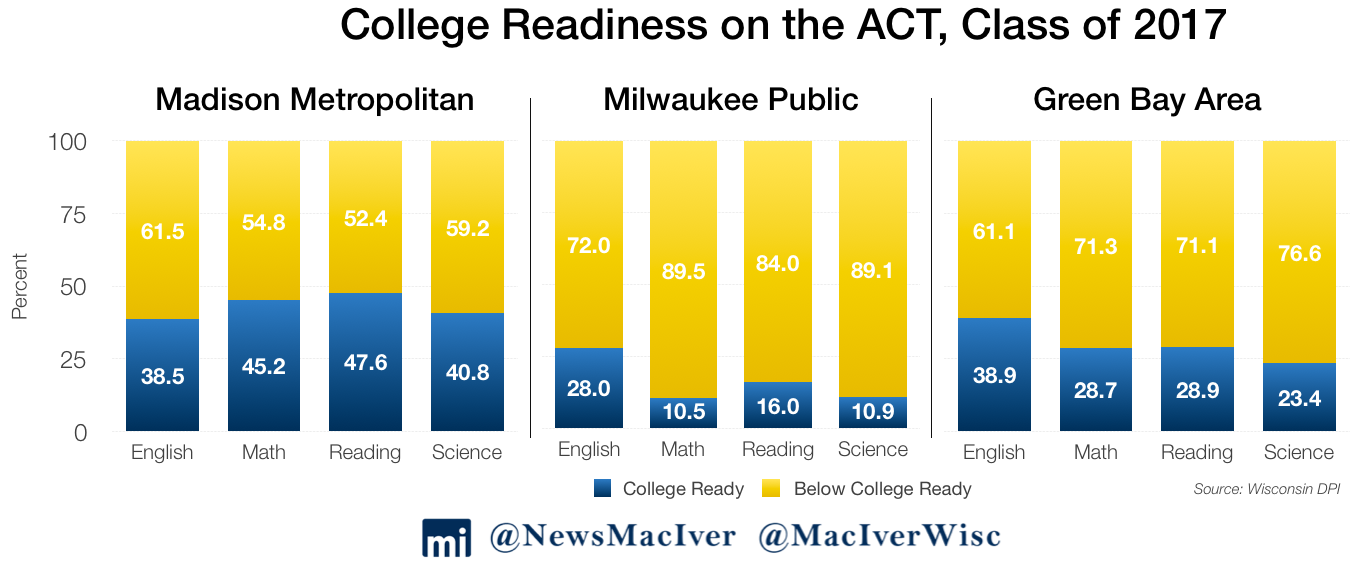
Scores varied significantly in Wisconsin’s largest public school districts. In Milwaukee Public Schools (MPS), students scored an average of 16.5 out of 36 points, significantly below the statewide average. MPS’ class of 2017 fared better than the class of 2016 in every subject, though participation fell from 95.3 percent to 90.6 percent. Student college readiness improved in every subject over the previous year, though all scores are still lower than the state average.
Over in Madison Metropolitan School District (MMSD), students fared slightly better than the average, at 21.5 out of 36 points. Read more about the results in some of the largest school districts for the ACT, ACT Aspire, and graduation rates here.
AP Scores
Another part of March’s data drop was information on AP Exams. Advanced Placement (AP) courses are college-level classes students can take in high school. AP classes are great for getting students accustomed to more challenging, faster-paced material. There are also significant financial incentives for students, who can choose to take the AP Exam at the end of their class in May for a chance at earning college credit. 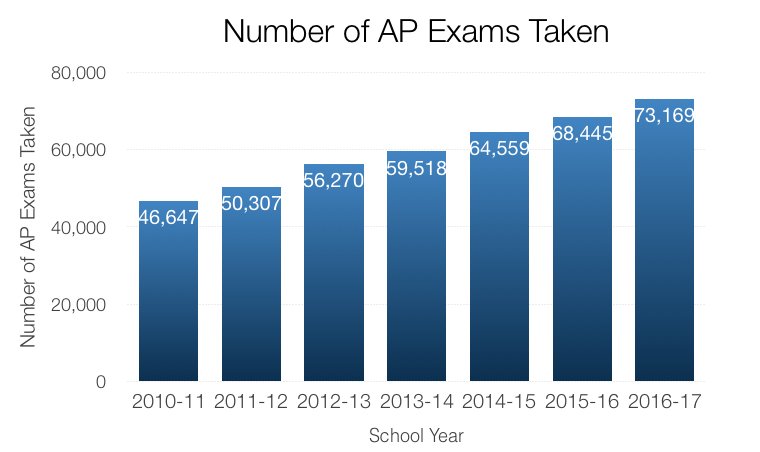
The exams are scored on a five-point scale. Many colleges and universities give credit for scores of four or five – but the University of Wisconsin System is quite generous in its AP policy. All scores of three or better earn students three credits in the related field of study. That means students come into college already having earned credit, not only saving them and their families thousands of dollars but also getting a leg up on those 120 credits to graduate. Plus, at the UW, students enroll in courses based upon how many credits 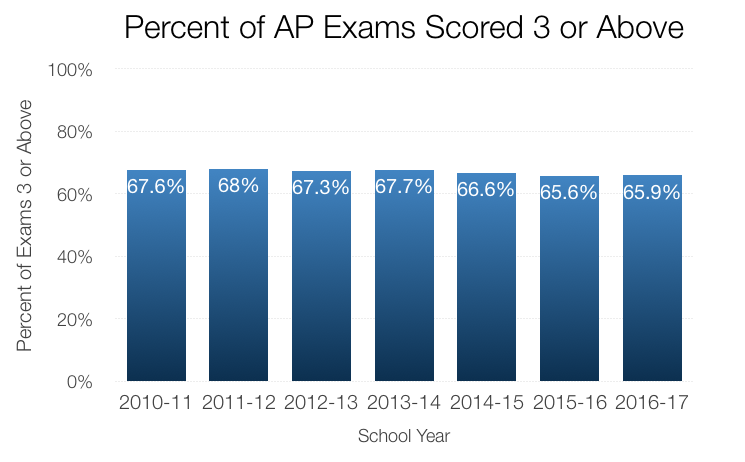 they have already attained. If they come in with AP credits, they get further ahead in the line for course enrollment.
Of all the AP Exams that Wisconsin students took in 2017, 65.9 percent of scores were a three out of five or higher. The student participation rate has steadily increased, which is good news for young Wisconsinites and their families. In 2017, 16.4 percent of all students took an AP Exam, continuing the trend of annual one percent increases in participation. We hope to see that number keep increasing.
The most encouraging number in the AP dataset is the sheer number of AP Exams taken in 2017–73,169 in all. That’s more than a 56 percent increase from 2011. Well done, high schoolers.
Graduation Rates and Achievement Gaps
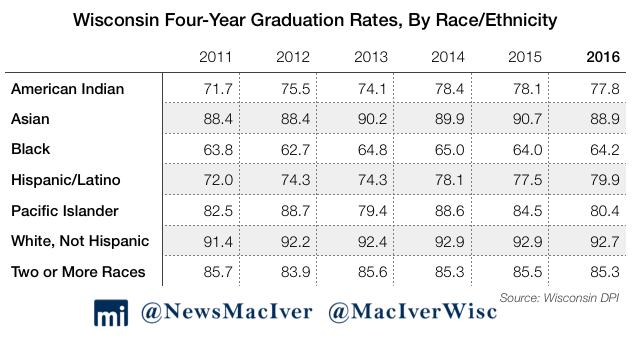
Wisconsin has long struggled with significant achievement gaps in four-year high school graduation rates, as well as almost every other performance metric. The gaps between white and black students, in particular, have regularly been the largest in the nation. Students have made some progress in closing the gaps, but they still persist.
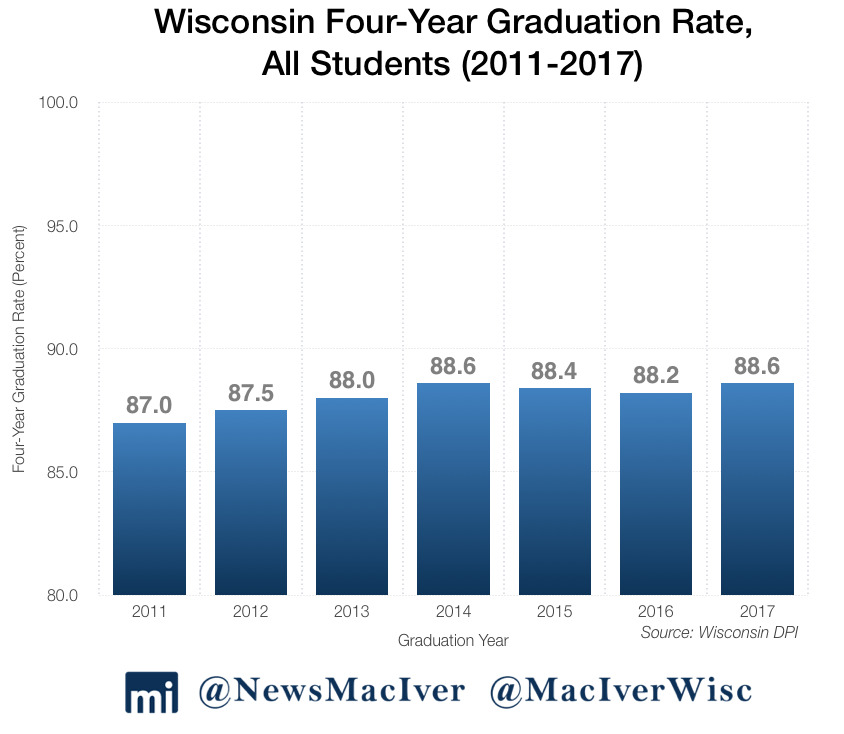
As a whole, 88.6 percent of Wisconsin students graduated high school in four years. That number has slowly trended upwards since 2011, with some ticks up and down.
White students have long posted the best graduation rates in Wisconsin. Of the class of 2017, 92.7 percent of white students graduated in four years.
Hispanic students have shown the greatest improvement in graduation rates—80.3 percent of hispanic and latino students graduated high school in four years in 2017, up by more than 8 points from 2011’s rate of 72.0 percent. The achievement gap between white and hispanic students has fallen by seven points since 2011.
The largest achievement gap remains between white and black students. Sixty-seven percent of black students graduated in four years in 2017, constituting a 25.7-point gap between the two groups. The black-white achievement gap has fallen by just 1.9 points since 2011.
Some individual school districts saw striking improvements in this area. Most notably, the achievement gap between white and black students at Madison Metropolitan fell to 18 points—down from 31 points in 2016. At MPS, the achievement gap is 14.9 percent, down from 17.1 in the prior year.
While 2016’s graduation rate data was released several months later than usual – and was laden with mistakes – 2017 numbers came earlier than expected. Zero school districts reported data errata in 2017, compared to 21 in 2016.
While achievement gaps and graduation rates have slowly improved, there’s another side to this coin. The next dataset we’ll examine shows that plenty of students graduating from high school simply are not ready for college.
Remedial Education
This little-known facet of education costs students and parents dearly. Before entering the UW System—usually the summer before freshman year—students take placement exams for English and math. If they don’t pass, they still get to start college in the coming fall, but they have to take remedial courses in addition to their regular course loads. Those are classes covering subject areas in which students should be proficient during high school, or earlier, such as algebra.
The state began tracking who needs remedial education, and from what high schools they graduate, in 2016. The second remedial report was released in December of 2017 regarding students entering the UW System in the fall of 2016. That’s the most current data we have today.
The data show that students from 184 Wisconsin high schools were required to take remedial math or English at the UW System as new freshmen. That’s an uptick from 175 schools the previous year.
Some high schools sent high percentages of students to the UW System needing remedial courses, raising questions as to how those students graduated high school, and why they were accepted into the UW System. Hence, this issue lives squarely between the K-12 and higher education systems.
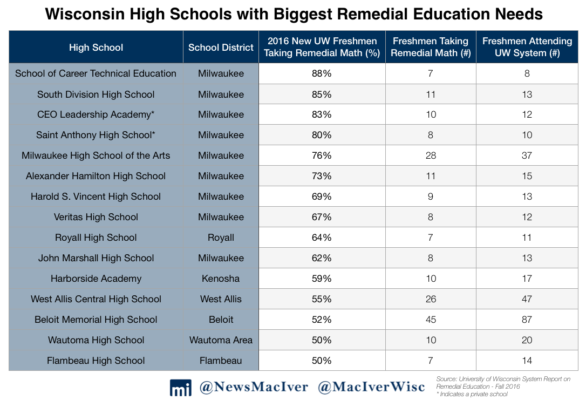
Fifteen high schools sent classes of students off to the UW wherein 50 percent or more of the class needed math remediation. Of those 15 schools, nine are in Milwaukee. Nine of the ten schools with the largest percentage of students needing math remediation are also in Milwaukee.
Perhaps most shocking in this report is the fact that many of the high schools in question are touted as high achieving. Nine of the schools included in the data report had received five-star rankings on the state report cards that were released just a month prior. A full 40 percent of the high schools that “significantly exceed expectations” had graduates who needed math or English remediation upon entering the UW System.
The issue extends to other rankings, like the U.S. News and World Report rankings of the best high schools in Wisconsin. Of the top ten schools on 2017’s list, nine of them sent students to the UW needing additional math. Only one of the top ten schools on that list, Carmen High School of Science and Technology, did not appear on the remedial education report. Carmen is a charter school at MPS.
Many more high schools had issues with math preparedness compared to English, but some schools struggled with both. More than half—52 percent—of the 87-person graduating class from Beloit Memorial High School needed math remediation at the UW System, and 24 percent needed English remediation. Back at MPS, nearly three-quarters—73 percent—of incoming Alexander Hamilton High School graduates needed math remediation, and 60 percent needed English remediation.
There are several implications in this data, not least of which are financial. Students pay full tuition for these classes, yet they don’t count for any credits. That’s right. Students actually pay hundreds of dollars per credit, that they must take to graduate, but the classes don’t even count towards the 120 credits required to graduate.
Ever wonder why student debt has exploded and many students have trouble getting out in four years? Remedial education is part of the reason why.
Report Cards
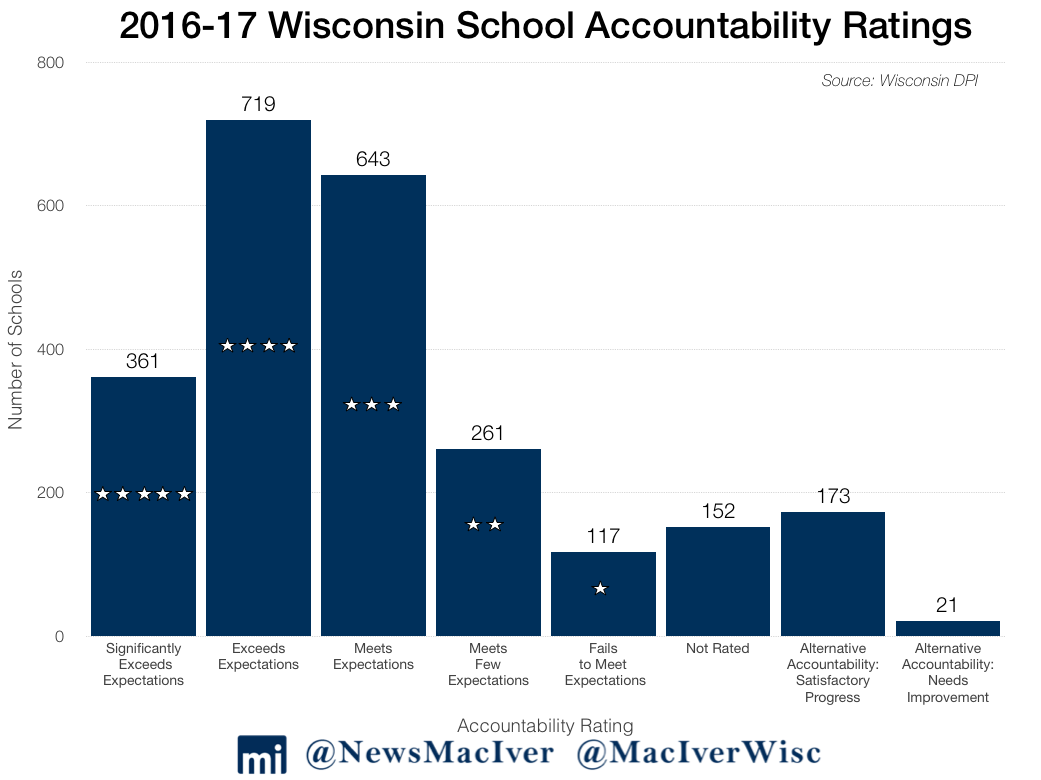
School and district report cards are perhaps the biggest education data release at the state level every year. This massive release gives every school and district in the state scores on a five-star scale, from “failing to meet expectations” to “exceeding expectations.” The last report cards were released in November 2017 for the 2016-17 school year, which means new report cards are just around the corner.
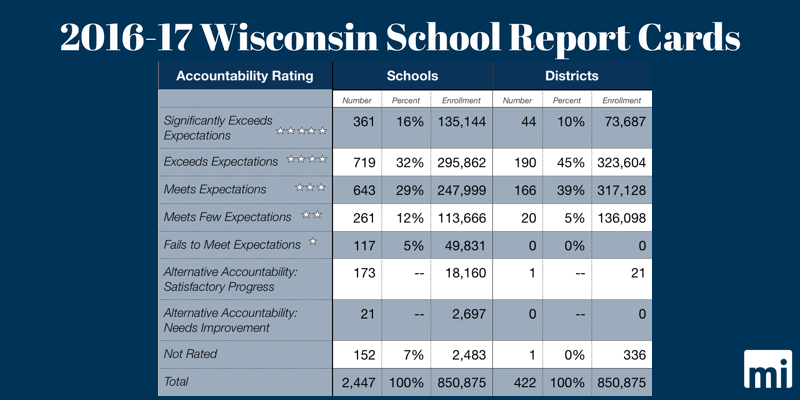
The big picture? There appears to be a significant disconnect between student performance and report card rankings. In 2017, zero school districts received a failing grade, down from five districts in 2016. At the same time, however, the number of failing schools rose from 99 to 117—an 18 percent increase. As a whole, the statewide achievement score is just 66 out of 100 points. MPS posted the lowest overall score of any district, at 56 points, though it just barely missed the official “failing” mark.
More than three-quarters—77 percent—of schools received three of five stars or more, signifying that they are doing well. The vast majority—94 percent—of districts fared the same.
However, almost 50,000 students attend 117 failing schools. That’s a population bigger than the city of Sheboygan, and just under the size of La Crosse. Within MPS, just four out of 138 schools received the highest ranking. These schools enroll more than 1,550 students. At the same time, nearly 25,000 students attend the 45 schools in MPS that received a failing grade.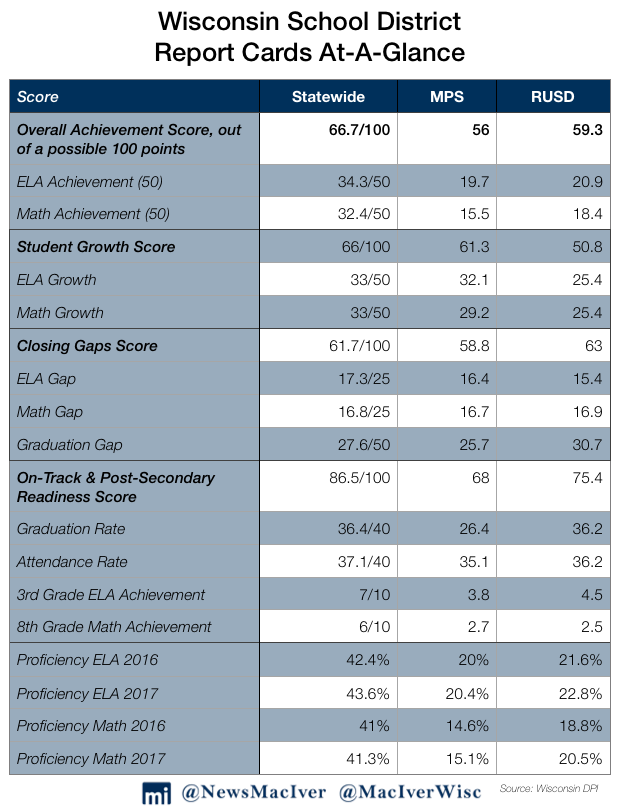
The report card scores are calculated based on several priority areas for students, including achievement, growth, closing gaps, and post-secondary readiness. Major weight is given to English language arts and math progress, but variables such as attendance and test participation are also taken into account.
Last year’s report card release was also the first time that private choice schools received report cards with accountability scores. Some private schools had received report cards for participants in the year before, but none received any official accountability rating because of a lack of data.
In 2017, 251 private schools received a report card. Twelve private schools enrolling 2,319 students earned five stars. Unfortunately, many more schools received a failing mark—25 private schools enrolling 6,138 students got the lowest rank.
At the same time, it’s important to note that enrollment in the parental choice programs is limited to impoverished students. When comparing similar populations of students, those in choice programs tend to have higher growth than their peers in public schools.
More than 200 public charter schools also received report cards in 2017, and many posted excellent results. Compared to other groups, charter students tend to outperform. A full 20 percent of charter schools ranked on the five-star scale earned top marks, while another 31 percent exceeded expectations. Nine percent of charter schools failed to meet expectations.
Worth noting, too, is that three of the top four best-rated schools in MPS are charters. This is certainly a group worth watching.
For last year’s full report card analysis, check out this read, and go here for a deeper dive into individual districts and school choice performance.
Forward Exam
As you can tell, Wisconsin students take a number of standardized tests.
When fewer than half of all young students are proficient in major subjects, there’s not much to celebrate.
One of the most important exams, and metrics for student achievement, is the Forward Exam. The Forward is administered to 3rd through 8th grade students every spring. The most current data we have for this exam is from the spring 2017 administration, which was made public in late September 2017.
Last year’s data release in this area was significant because it was the first time in many years that the public could directly compare results with the prior year. That’s because the state of Wisconsin changed the exam three times in three years. Comparing proficiency across different exams is a no-go—so we hope the state sticks with the Forward Exam for some time to ensure that we can accurately track the growth and achievement of our students over time.
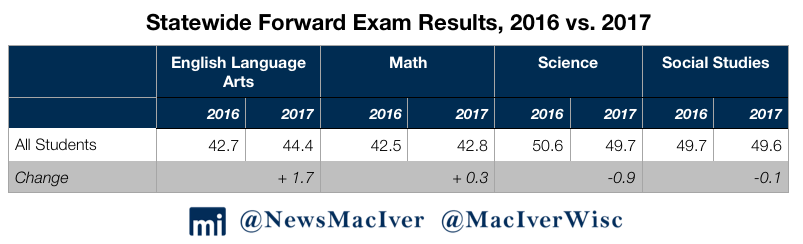
The 2017 results show that 44.4 percent of students are proficient in English language arts, while 43.8 percent are proficient in math. Those results are slightly better than the year before, when 42.7 percent of students were proficient in English language arts and 42.5 percent in math. Fewer than 50 percent of students scored proficient in both science and social studies.
As a whole, student results on 2017’s Forward Exam were rather worrisome. When fewer than half of all students are proficient in all major subjects, there’s not much to celebrate. At the same time, bright spots can be found.
MPS students posted slight improvements in both English language arts and math. The math achievement gap between black and white MPS students shrank slightly, to 28.9 points. A meager 8.4 percent of black MPS students were proficient in math.
This data release was where private choice students really shined. Students in all three parental choice programs – statewide, Milwaukee, and Racine – outperformed their peers in every subject on the Forward.
As we noted above, it’s important to reiterate that the school choice programs impose income limitations. As a result, larger percentages of choice students are economically disadvantaged than typical public school students. For that reason, it’s more accurate to compare choice school students with economically disadvantaged public school students.
ACT Aspire
Another part of March’s dataset included results for the ACT Aspire. The relatively new exam is taken by high school freshmen and sophomores to prepare for the real ACT. That makes the ACT Aspire less critical than the ACT, but it still provides an opportunity to see if students are on track to be college ready. Unfortunately, ACT Aspire results were perhaps the most bleak dataset of the March release. Fewer students demonstrated proficiency on the ACT Aspire in almost every subject compared to the prior year.
Students fared the best in English, with 57.5 percent of exam takers “ready or exceeding.” The prior year, 60.4 percent of students had earned the same distinction. In math, just 37.1 percent of students were ready or exceeding, down from 38.9 percent in 2016.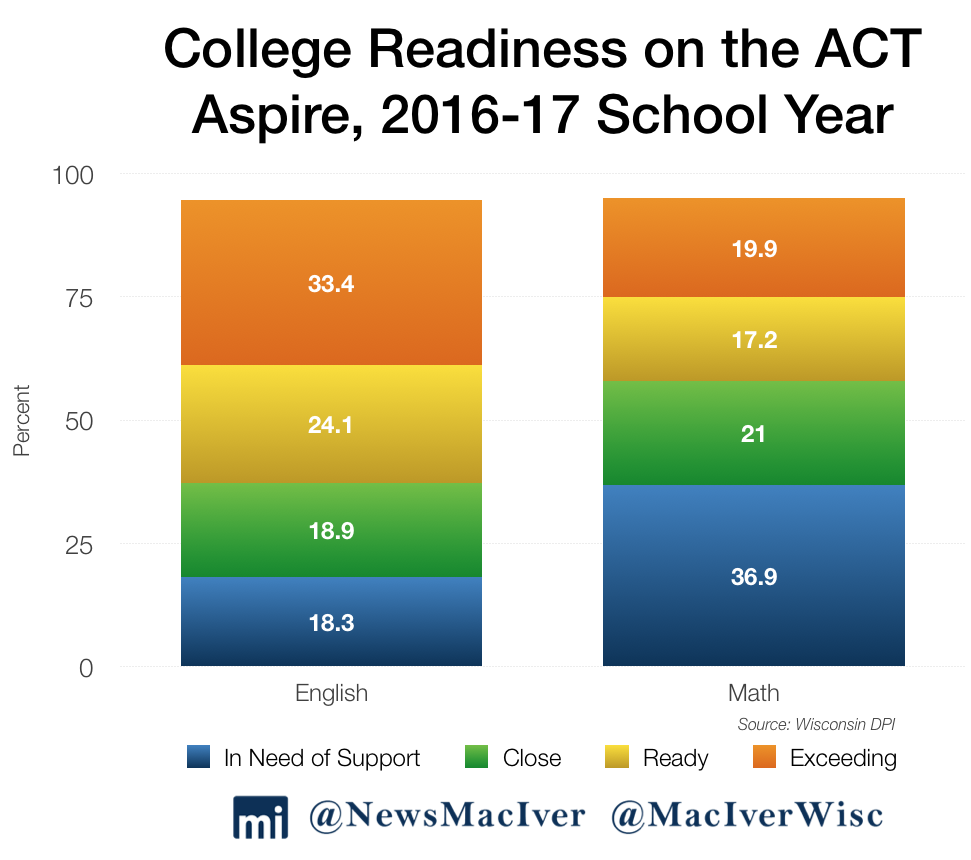
Writing was the only ACT Aspire subject area where students improved over the year before, though it was a small increase—51.4 percent of students were ready or exceeding, compared to 51 percent in 2016.
At Madison Metropolitan, students did worse in almost every subject on the ACT Aspire compared to the year before. Fifty-five percent of students scored “ready or exceeding” in English—a full ten-point drop to just two years prior. Just over one third, 36 percent, of students were ready or exceeding in math.
MPS students struggled more, with 8.3 percent ready or exceeding in math and 24.2 percent in English. Racial disparities persisted throughout the data. Half of all white MPS students were ready or exceeding on the ACT Aspire, while 15.8 percent of black students fared the same. Both groups of students earned worse marks than the prior year, and the achievement gap between them grew from 32.9 to 34.4 points.
ACT Plus Writing
We’ve already covered a few different ACT-related datasets, so we won’t go too deep into this one. The state of Wisconsin pays for all high school juniors to take the ACT exam once. Another part of the data release from September of 2017 included the test results for spring 2017’s administration. The ACT results covered earlier in this analysis are the average of all exams taken by class of 2017 students.
On the ACT Plus Writing, students scored an average composite score of 20.0 out of 36 points. That’s a small tick down from the 20.1 points students earned in 2016. Average scores in English language arts fell from 18.6 to 18.3, while math scores fell from 20.1 to 20.0. At 20.4 out of 36 points, students scored the highest average score on science – but even that subject area was a retreat from the previous year’s 20.5.
Read more about this particular dataset here.
Before moving onto other indicators, here’s a preview of what’s to come in the next few months. As you may be able to tell, late fall is always a busy time for education data releases. This year will be no different. The achievement data drops through the rest of the calendar year are:
- Spring 2018 Forward Exam results, slated for late September or early October
- National ACT results with state-to-state comparisons, slated for mid-October
- 2018-19 preliminary enrollment counts, slated for October
- 2017-18 report cards, slated for November release
- UW remedial education report for Fall 2017, slated for November or December release
Financial data will come out toward the end of the year, too. Speaking of finances, check out this analysis to get a refresher on last year’s budget, which set state funding levels for schools through 2019.
We’ve also done plenty of work on individual school district budgets, especially MPS. That district, and many others, will finalize their 2018-19 budgets this fall. Read our analysis on MPS’ preliminary budget, which was passed in June, here.
Still with us? Great. Let’s move onto other indicators of success. Test scores are important, but they’re not everything.
Enrollment
As a whole, Wisconsin’s K-12 student enrollment has stayed largely flat, while funding for education has trended upward. We haven’t seen a massive dip in the overall student population, but more students are opting out of the traditional public system.
Figures from 2017-18 showed that public school student enrollment fell by 0.41 percent, or 3,743 students. That continues a long trend of students leaving the traditional public school system for other options. Where are they going? That brings us to our next section…
School Choice in Wisconsin: Growth and Results
As we detailed earlier in this piece, school choice students tend to post stronger results than their peers. There are still too many schools that earned low scores on report cards, but it appears that students in these programs are trending in the right direction.
Aside from scores, Wisconsin has seen a remarkable increase in the number of choice participants in recent years.
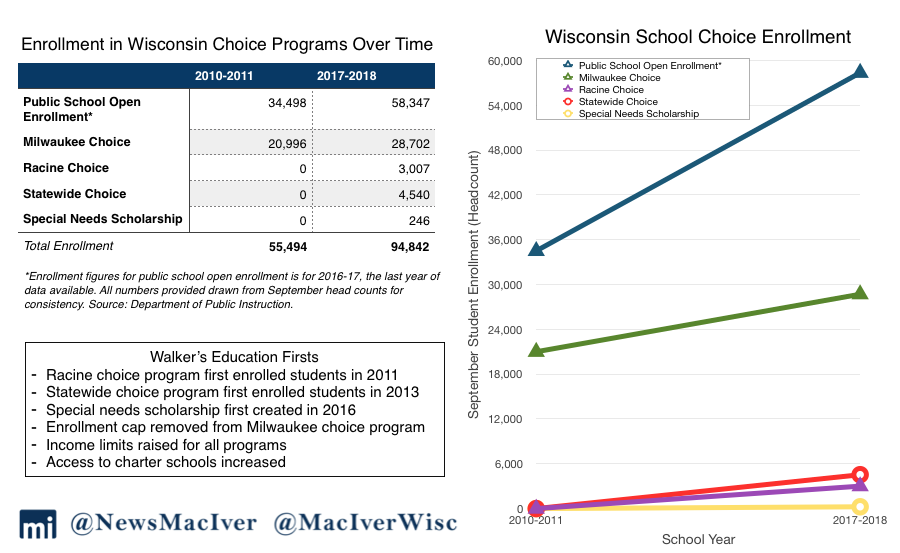
Among parental choice programs in Milwaukee, Racine, statewide, plus the special needs scholarship program and public school open enrollment, 94,842 students across the state participated in a form of school choice last year. That’s a remarkable 71 percent increase from the 2010-11 school year.
94,942 students across the state participated in a form of school choice in 2017-18. That includes public school open enrollment, all three parental choice programs, and the special needs scholarship program.
Since the beginning of Gov. Scott Walker’s tenure, students trapped in failing schools have been given more and more opportunities to try alternative forms of education. Milwaukee’s parental choice program—the oldest in the country—has seen access opened up in a number of ways. The program no longer has any enrollment cap, is accessible for families earning up to 300 percent of the federal poverty line, and schools have no more geographic requirement. Milwaukee’s program is the biggest of the three parental choice programs, having enrolled 28,702 students last year.
The biggest and oldest form of school choice in the state is public school open enrollment. That allows students to attend a public school district outside of their home’s boundaries. That program has seen significant growth in recent years, with 69 percent more students participating since the 2010-11 school year.
The newest form of school choice in Wisconsin, the special needs scholarship program, is starting its third year. The program allows qualifying students to receive a voucher to attend private schools if they are not satisfied with their public school education. The program has seen stunning growth. This year, 84 schools are participating, including 56 that are new to the program.
This summer, the state’s Legislative Audit Bureau released a full audit on the SNSP. The report surveyed the parents of all 306 participating students. Parents were happier with the new schools. The survey reported decreased levels of behavioral problems and negative experiences as a whole compared to when their children had attended public schools. That’s great news for this young program. We hope to see similar results in the future.
State Comparisons: Enrollment, Graduation Rates, ACT, and Funding
While Packers fans know we’re the best there is (back to school, of course, also means back to the gridiron), Wisconsin doesn’t exist in a vacuum. It’s always good to know how we compare to other states, especially to our neighbors in the Midwest.
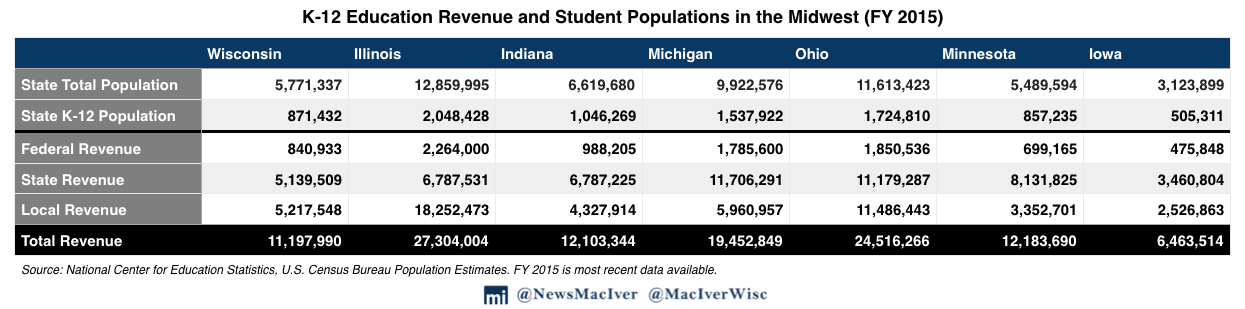
As it turns out, Wisconsin is in the middle of the pack when it comes to overall student revenue and spending. According to federal data from 2015, the most recent year available, Wisconsin spends $12,850 in revenue per pupil. That’s the median figure for the seven-state Midwest region, and is just below the Midwest and US averages.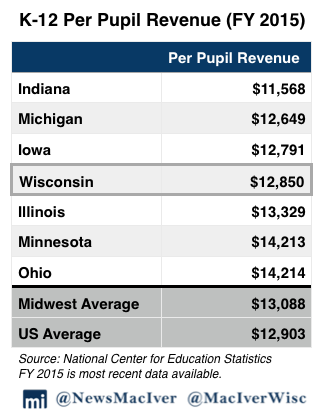
At the same time, Wisconsin students achieve higher scores than their peers. Graduation rates are among the highest in the country, as are ACT scores for the class of 2017. Wisconsin is one of 17 states that tests all students on the ACT. Of those, Wisconsin’s average score of 20.5 out of 36 is the third highest behind Minnesota (21.1) and Colorado (20.8). (ACT’s own figures are slightly different from DPI’s ACT numbers that we discussed earlier in this piece.)
It’s important to note that Wisconsin can only be compared to other states that also administer the test to all students. In states where taking the ACT is purely voluntary, only the students who plan on going to college take the exam, pushing the average score upwards. That’s why we always expect to see a slight dip in scores whenever participation increases, whether it’s the ACT, AP Exams, or any other achievement metric.
Since the ACT began administering a new test every July for the first time this year, national comparisons will come out a bit later than usual. Look out for those numbers, and our reporting on them, in the coming months.
As for graduation rates in the Midwest, Wisconsin’s graduation rate of 88 percent is bested only by Iowa, where high schoolers posted a 91 percent four-year graduation rate. Those numbers come from the 2015-16 school year, the most recent data available from the National Center for Education Statistics. That year, the national average was 84 percent, and the Midwest’s average was 85 percent. In the same dataset, however, Wisconsin showed the largest achievement gap – 29 points – between the graduation rates for white and black students. As a whole, Wisconsin has one of the best graduation rates in the country, but that’s clearly not true for all of our students. We simply have to do better, and that means all of us. Kids – time to put down the Fortnite and hit the books. School is back in session.
—
That wraps up The MacIver Institute’s State of K-12 Education: 2018 Edition. We hope you enjoyed reading about the many trends in education that often get lost or glossed over in the media’s usual coverage. Tune in for the State of Higher Education: 2018 Edition tomorrow, when the University of Wisconsin System’s students head back to class.
As always, On, Wisconsin.