
Achievement gaps are slowly shrinking, but poor results on the “pre-ACT” exam shows students are still struggling
March 14, 2017
By Ola Lisowski
The Department of Public Instruction (DPI) recently released a massive amount of data on student performance across the state. The new data cover a slew of metrics from graduation rates, to the ACT scores of the class of 2017, to the ACT Aspire, to AP exams, and then some. We first covered the results here, but there’s plenty more to examine.
Achievement Gaps
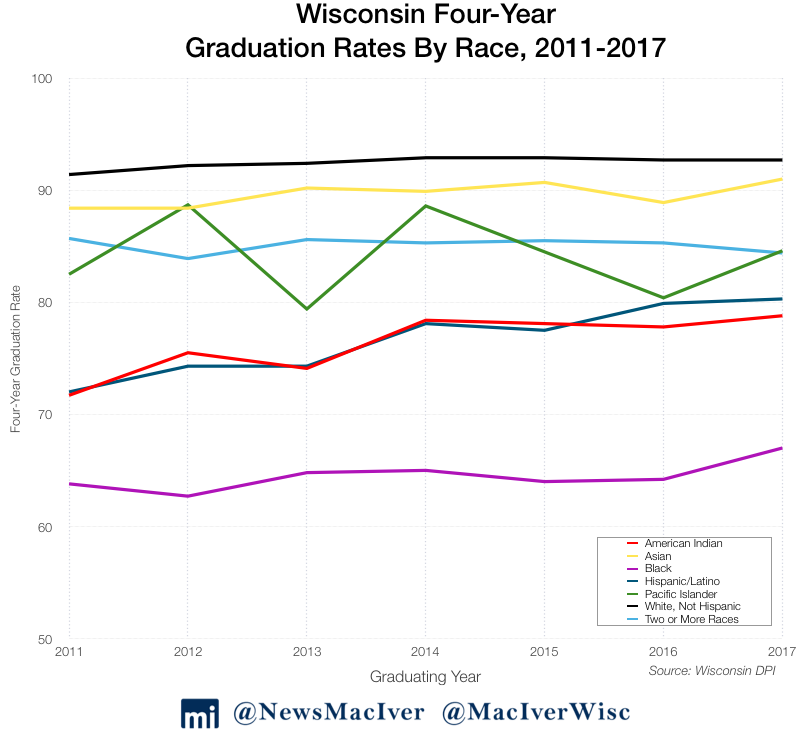
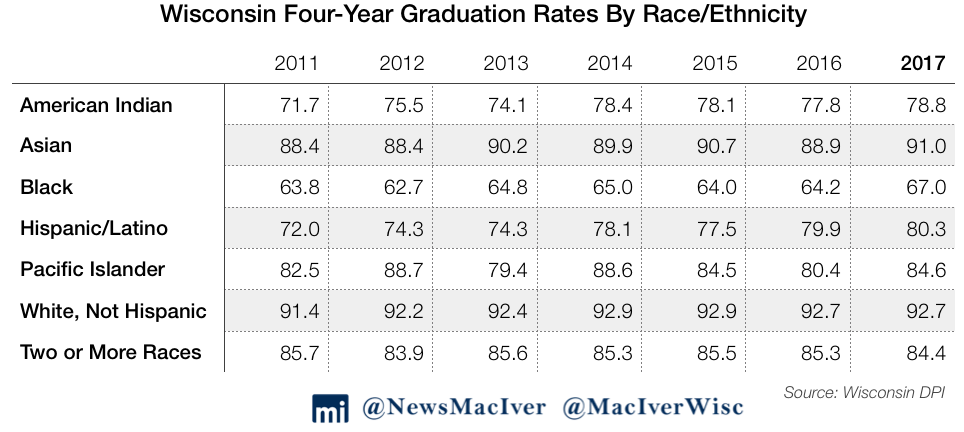
Wisconsin has long struggled with significant achievement gaps in four-year graduation rates and other performance metrics, often posting the largest gaps in the nation. For the class of 2017, those gaps largely persisted, though the data shows some improvements.
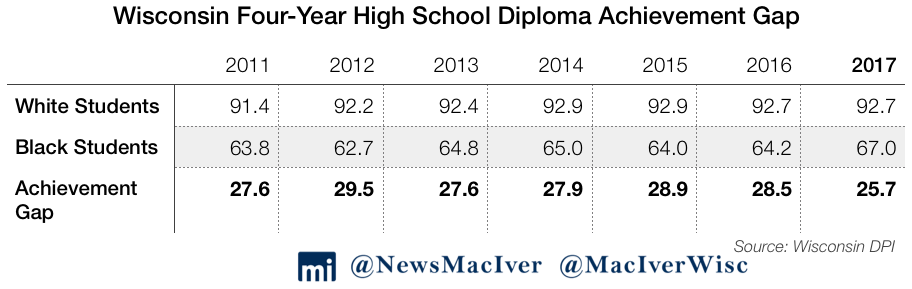
White students graduated high school at the same rate as the previous year – 92.7 percent – while the rate for black students increased by 2.8 points to 67.0 percent. The four-year diploma achievement gap fell to 25.7 percent in 2017 from 28.5 percent in 2016.
The gap between white and hispanic students has closed at a much faster rate. While the diploma gap between white and black students was 27.6 points in 2011, it is just 1.9 points lower today. In the same time, the gap between white and hispanic students shrank by seven points. The achievement gap between white and hispanic students fell from 19.4 points in 2011 to 12.4 points in 2017.
Students at Madison Metropolitan School District (MMSD) saw striking improvements, though overall rates remain low. While the graduation rate increased by 1.2 points to 90.7 percent for white students, black students saw an impressive increase of 14.1 points to 72.6 percent. The diploma achievement gap at MMSD now stands at 18.1 points, down from a 31-point gap in 2016.
MMSD’s 18-point achievement gap between white and black students is smaller than the gap at Milwaukee Public Schools (MPS), the state’s largest school district. At MPS, the achievement gap between white and black students is now 14.9 percent, down from 17.1 a year ago.
Though MPS’ achievement gap between large ethnic and racial groups is smaller than the state’s average, overall graduation rates are significantly lower. The district’s average graduation rate is 62.2 percent, with 58.4 percent of black students and 73.3 percent of white students graduating in four years.
At Green Bay Area Public (GBAP), the graduation gap also shrank slightly while overall graduation rates increased by a hair, from 83.8 percent to 84 percent. Black students improved over the previous year, increasing average graduation rates from 66.4 percent to 69.3 percent. White students fared worse than the prior year, with rates falling from 90.1 percent to 88.7 percent. The four-year diploma gap between white and black students fell from 23.7 points to 19.4 points.
Last year’s graduation data release occurred several months later than expected, and was laden with erratic data from 21 school districts. Zero districts reported data errata this year, and the release came ahead of schedule.
The ACT Suite Exams
Standardized testing has gone through considerable changes in recent years, and the ACT is no exception. Last year was the first that the state of Wisconsin paid for all high school juniors to take the ACT, drastically bringing up participation rates from 63.5 percent to 92.1 percent statewide. In 2017 both the participation rate and average composite score of 20.3 out of 36 remained the same.
At the same time, students have begun taking the ACT Aspire, a new exam for freshmen and sophomores in high school. The ACT Aspire gauges students’ preparedness for the full-fledged ACT used for college applications. While ACT scores remained flat, ACT Aspire scores fell across the state.
At Madison Metropolitan, students did worse in almost every subject compared to last year on the ACT Aspire. Fifty-five percent of students were ready or exceeding in English and just 36 percent in math. The percent of students considered ready or exceeding on the ACT Aspire English section fell by ten full points from just 2015 to 2017, to 54.9 percent. That was more drastic than the nearly 8 point drop at MPS, or the 3.3 point drop statewide during the same time period.
MPS students struggled even more, with just 8.3 percent ready or exceeding in math. Just 24.2 percent of MPS students were ready or exceeding in English – less than half of the statewide figure.
Racial disparities persisted throughout ACT-related data. While 50.2 percent of white MPS students were ready or exceeding on the ACT Aspire, just 15.8 percent of black students fared the same. Both groups of students fared considerably worse than the prior year, and the achievement gap between them grew from 32.9 points to 34.4 points.
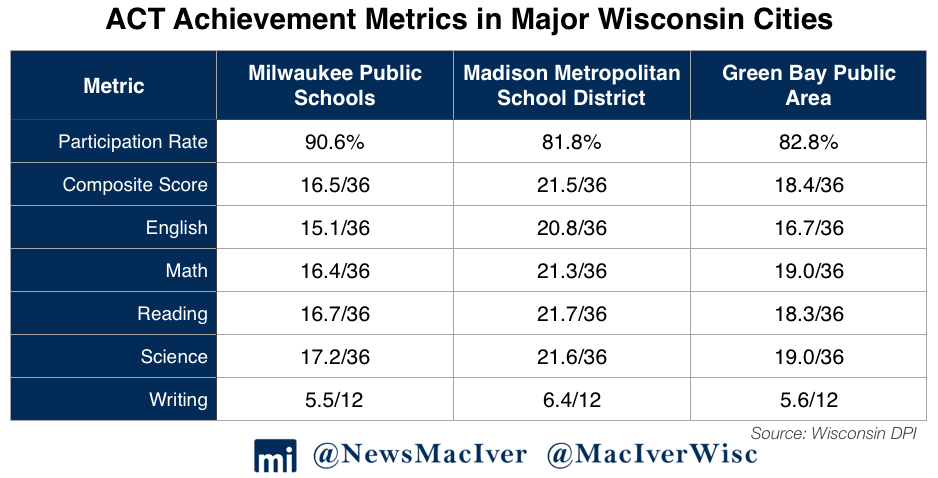
MPS graduates of the class of 2017 fared better on the ACT than the class of 2016 in every subject, though participation fell from 95.3 percent to 90.6 percent. Student college readiness also improved in every subject, with the biggest
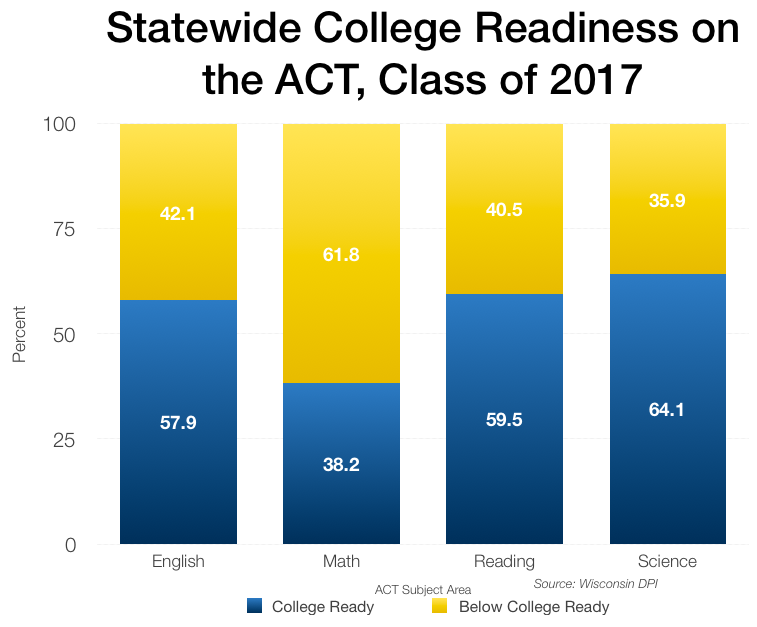
increase occurring in the reading section, where 16 percent of MPS students are now considered college-ready, compared to 13.7 percent last year. Still, 16 percent is a low bar, and it’s far below the state average of 40.5 percent. While 35.9 percent of students statewide were considered college-ready in science on the ACT, just 10.9 percent fared the same at MPS.
While MPS students improved proficiency across the board – though scores were still lower than the state average in every subject – MMSD students earned the same or lower scores in some subjects. The average composite score at MMSD was 21.5 out of 36, a sliver higher than last year’s 21.4. Students’ reading score fell to 21.7 out of 36 points, and stayed flat at 21.3 in math. Scores in English, science, and writing all increased.
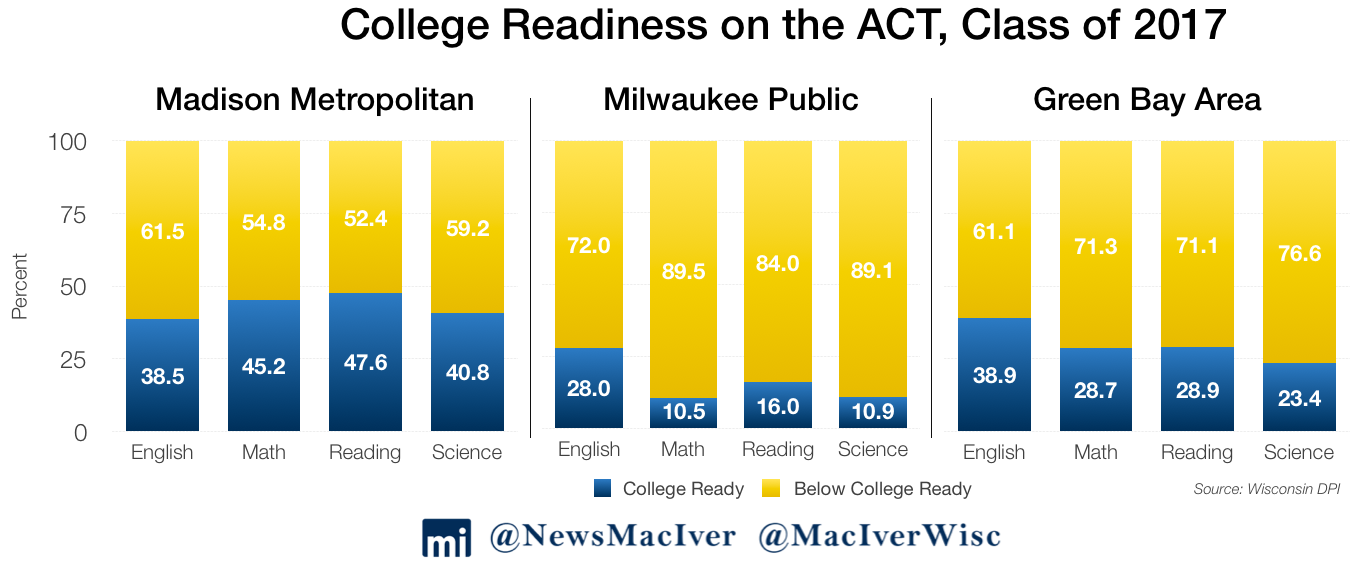
Students at GBAP fared worse on the ACT than their MMSD counterparts, with an average composite score of 18.4 out of 36, down slightly from 18.7 the prior year. The participation rate also fell from 86 percent in 2016 to 82.8 percent in 2017, raising questions about why both the participation rate and the average score fell. The percent of college-ready students fell from 42.4 percent to 38.9 percent in the English section, and from 33.5 percent to 28.7 percent in math. Neither Madison nor Milwaukee saw that kind of drop.
The full ACT is a much more important exam that carries significantly more weight than the ACT Aspire. While students are taking more college prep exams, they’re also taking more college prep courses.
Advanced Placement Exams
In high school, students can take Advanced Placement (AP) classes that are typically considered college or near-college level. AP classes are challenging and a great way for students to learn how to study – plus, they can choose to take the AP exam at the end of the course.
The exams themselves offer a chance at saving real money in college. The University of Wisconsin-Madison, for example, offers a minimum of three credits for a score of three or higher on any AP exam. If students know they want to move on to higher education, AP classes and exams are a great way to get a head start.
AP exams scores, student participation rates, and the number of exams taken in Wisconsin all increased in the last year. The participation rate is a particularly promising trend – just 16.4 percent of students took an AP exam, but that number has increased by a full percentage point every year for three years in a row. The number of exams increased by 7.9 percent in just one year, showing that more students are taking more than one exam.

MMSD students in 2017 took 23 percent more AP exams than they did the previous year, a stunning one-year increase. Nineteen percent of students took an exam, up from 16 percent in 2016. The only negative trend for AP exams in Madison was that the percentage of exams scored three or higher fell from 79 percent to 77 percent – but a score drop is almost always expected with such a massive increase in participation. The scores are also higher than the state average, showing that AP classes are by-and-large sufficiently preparing students for the big exam that actually gets them credits.
Up in Green Bay, more GBAP students took AP exams than last year, with a 12.6 percent participation rate in 2017, up from 11.1 percent in 2016. Scores are slightly higher than the state average at 68.7 percent of tests scored three or above. That’s an increase from last year, but overall, scores have stayed largely flat over the last few years.
Of the larger school districts, MPS students struggled the most on AP exams. Just 19.2 percent of exams earned a three or higher, far below the 65.9 percent statewide average. Just 9.5 percent of MPS students took an AP exam in 2017, up a hair from 9.1 percent in 2016. One shining light in MPS’ statistics – the one-year increase in the number of exams taken was 8.6 percent, higher than the state increase of 7.9 percent.
College Attendance
DPI also reports on the percentage of Wisconsin graduates who are enrolled in postsecondary institutions. These numbers are updated every year, so they slowly tick up as students who take gap years end up in school down the road. Even considering that, however, a trend is emerging: students are choosing not to move on to college. Just 55 percent of 2017 graduates are now enrolled at a postsecondary institution. In 2013, 71 percent had done so.
This number can stem from a lot of different things and could be spliced in different ways. A highly skilled, highly educated populace is certainly a good thing, and college degree attainment almost always translates to higher wages. However, costs have skyrocketed in recent decades, and the rate of return isn’t what it used to be. Students must now consider how and where they go to college perhaps a bit more carefully than the high school graduates of the 80s and 90s. As the job market improves, it’s also possible that more students are choosing to go right into the workplace rather than getting degrees.
Large school districts across the state saw a similar trend occur. Of 2017 MMSD graduates, 63 percent are enrolled at a postsecondary institution, down from 69 percent of 2016 graduates. Forty percent of 2017 MPS graduates are enrolled, down from 49 percent the year before. GBAP saw an even larger drop in postsecondary enrollment than the statewide average – 52 percent of 2017 graduates are enrolled somewhere today, compared to 71 percent of 2013 graduates.
Enrollment, Attendance, and Dropouts
Public school enrollment has been declining for years, driven by a mix of factors but largely by the fact that families are choosing alternative schools. As public school enrollment drops, private school enrollment increases year over year. Remember – the data reported here only applies to publicly funded students or those at public schools. Over 120,000 students attend private schools in Wisconsin today.
From the 2016-17 school year to 2017-18, public school enrollment fell by 0.43 percent, or 3,743 students. At the same time, funding for schools increased by over $600 million in the 2017-19 biennial budget – a historic increase.
The statewide dropout rate has held steady, at 1.5 percent in both of the last two years. Attendance fell slightly to 94 percent, from 94.9 percent.
Certain districts strayed from the norm – MPS’ dropout rate fell from 7.2 percent in 2016 to 6.2 percent in 2017, a considerable drop, but still much higher than the average. At 88.3 percent, MPS’ attendance rate is also considerably lower than the state average, and it fell by 1.1 points from the prior year. MMSD’s dropout rate ticked up a hair to 2.0 percent from 1.7 percent, while attendance fell slightly to 93.5 percent. GBAP’s dropout rate fell to 2.5 percent, trending downwards from a rate north of 3 percent for the last several years.
Worth noting is the issue of the Obama-era Department of Education’s “Dear Colleague” letter to schools and districts regarding dropout rates. That letter instructed locals to watch for racial disparities in suspensions, expulsions, and dropouts, potentially leaving federal funding on the line. Since then, reports such as Dan O’Donnell’s Blood on the Blackboard have revealed how violence in classrooms has increased as school officials refuse to remove violent students from school in fear of affecting suspension rates. As the Governor and legislative leaders call for a special session on school safety, the issue could become more prevalent.
—
The data released by DPI offers a mixed bag with plenty to explore. Are there any subject areas you’d like us to explore? Let us know in the comments below!