
- Podcasts
 Podcasts
 - Videos
 Videos
 - Policy Issues
 Policy Issues
 - About
 About
About


How the new “cut scores” impacted Wisconsin’s 2024-25 school and district report cards was a top question in political circles after DPI released the data on Tuesday this week.
The cut scores determine which rating category schools and districts fall under, using a five-star scale. The Wisconsin Department of Public Instruction (DPI) revised the cut scores this past August, and there was wide speculation that the revisions would result in schools and districts receiving higher ratings. A MacIver analysis found the opposite happened.
No school nor school district received a higher rating this year because of the new cut scores. However, there were 207 schools and 40 school districts that received lower ratings because of the new cut scores. The reason is simple. The new cut scores have higher thresholds than the previous scale. In fact, 84 is now the minimum score to qualify for a five-star rating of “significantly exceeds expectations.” Previously, it had always been 83.
However, this is not the first time the cut scores were revised. This is the third revision. The second revision was in effect from 2020 to 2024. The first revision went from 2012 – 2019. Compared to the original standards, 51 schools and 4 school districts would have received higher scores this year. Meanwhile, 351 schools and 74 school districts would have received lower scores this year.
This was no the first time that the cut scores had been revised. The original standards were established in 2012. They were revised in 2020. This year they were revised a third time. The 2020 standards were arguably the laxest, while the 2012 standards were overall the toughest. Under the 2012 standards, 134 schools and 1 district would have received a one-star rating with their scores this year.
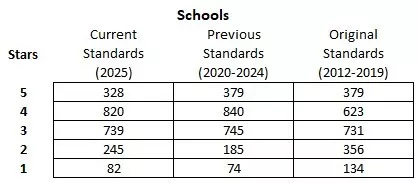
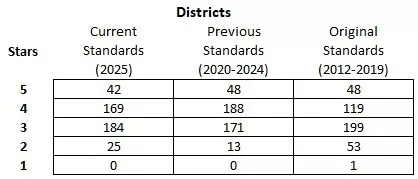
Although the new cut scores get the blame for inflating school and district performance, the real culprit is the practice of category weighting.
“Overall Score” is the top metric on the report cards. There are four categories that determine that score: achievement, growth, on-track, and target group outcomes (TGO). Each individual category is based on a 100-point scale. When those scores are combined to calculate the overall overall score, each category is weighted differently based on the percentage of economically disadvantaged students in attendance.
When a school or district has no economically disadvantaged students, the weights are: achievement 45%, growth 5%, on-track 25%, and TGO 25%. When 100% of a school or district’s students are economically disadvantaged, the weights are: achievement 5%, growth 45%, on-track 25%, and TGO 25%. The scale is sliding, and DPI has a calculator to help officials calculate the weighting scale.
The MacIver Institute conducted an analysis to see how the weighting affected overall ratings. It applied the same standards (0% economically disadvantaged students) to all districts. It found that the weighting enabled 41 districts to improve their rating, while 25 districts actually received a lower rating because of the weighting. Finally, 3 districts would have received a one-star rating without the weighting.

Interested in the content of this Article?
Reach out to the MacIver Institute to aquire more information


