
- Podcasts
 Podcasts
 - Videos
 Videos
 - Policy Issues
 Policy Issues
 - About
 About
About


Accounting for Growth in Wisconsin: Performance and Prospects
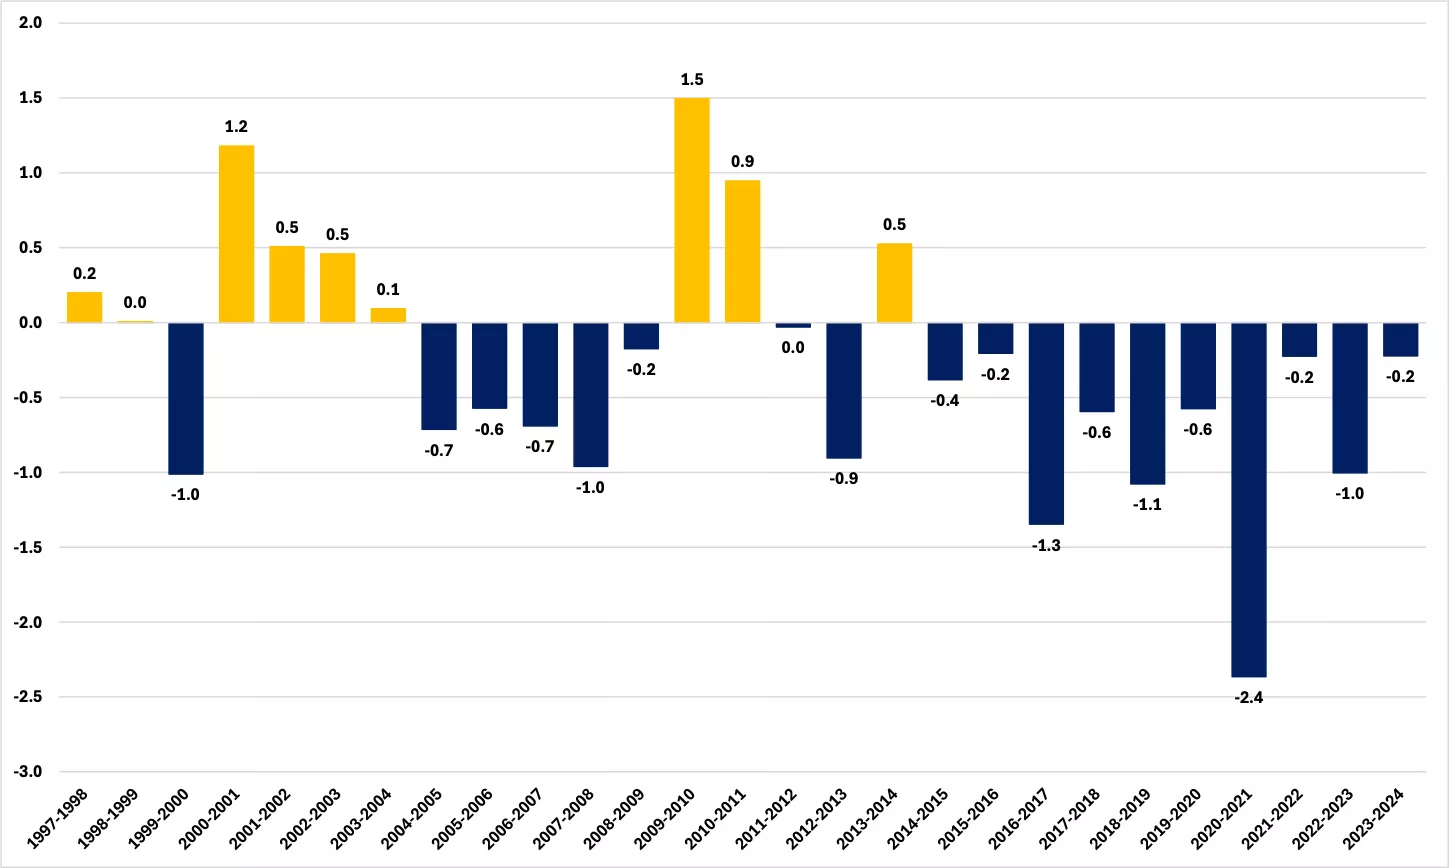
Between 1997 and 2014, Wisconsin's economy kept pace with the rest of the United States. Per capita GDP growth exceeded the national average in 9 years, and lagged behind in only 8 years.
After 2014 however, the growth in the Wisconsin economy has not only fallen short of the national average, but has lagged the rest of the United States in every single year since. Wisconsin has not only been a poor performer in this regard, but has been the worst performer in the United States.
So why did this happen and how do we fix it?

Executive Summary
Wisconsin has a hardworking population, scoring well on the measures of the “raw” labor components of human capital, employment and hours worked. But these workers, on average, have middling knowledge capital — skills derived from education and experience — compared to other states. In addition, they have relatively little physical capital to work with.
The Importance of per Capita Economic Growth
What matters for economic welfare is per capita income. This is a general measure of welfare, indicating how much per person is available for consumption, investment, or other uses. If we want to increase economic welfare, we should pursue policies that increase per capita Gross Domestic Product (GDP).
Wisconsin’s recent record on real per capita GDP growth is concerning. As Figure 1 shows, over the 17 years from 1997 to 2014, the Badger State recorded a growth rate higher than the United States generally in nine (highlighted in yellow). Per capita GDP in Wisconsin largely held steady relative to the United States, going from 93.3 percent of the national level in 1997 to 93.6 percent in 2014, as Figure 2 shows. After that, however, Wisconsin saw a rate of per capita GDP growth slower than the United States in every single year and, in 2024, the state’s per capita GDP was down to 86.6 percent of the national level. Wisconsin is the only state to have lagged the United States for per capita GDP growth in every year since 2014.
Figure 1: Growth of Real Per Capita GDP in Wisconsin Minus Growth of Real Per Capita GDP for the United States, Percentage Points
 Source: Bureau of Economic Analysis and Center of the American Experiment
Figure 2: Per capita GDP in Wisconsin as a share of United States level
 Source: Bureau of Economic Analysis and Center of the American Experiment
What accounts for the relative slowdown in Wisconsin’s growth in the period after 2014? To answer this, we need to examine the components of real per capita GDP growth.
Per capita economic growth comes from three sources. These are an increase in “human capital,” the quantity and quality of the labor performed in an economy; an increase in “physical capital,” the tools these workers have to work with; and increases in “Total Factor Productivity (TFP)” (“The effectiveness with which factors of production are converted into output”), which is also known as Technology (“the way inputs to the production process are transformed into output”).[1]
Determining how a country or state is performing with regard to these sources is vital for identifying policies that will boost real per capita GDP growth. Policies that increase employment or skills raise human capital; policies that stimulate increased capital investment elevate the amount of physical capital; and policies that spur increased innovation and entrepreneurship catalyze TFP growth.
Economists use a technique called “growth accounting” to break down the observed rates of change in real per capita GDP into the shares derived from changes in human capital, physical capital, or TFP, by subtracting weighted values for human and physical capital growth from per capita GDP growth, with the residual being assigned to TFP.[2] To enable such an analysis for the states, we have created estimates of human and physical capital for each year from 2008 to 2024, available in the American Experiment United States Tables.[3] The results of a growth accounting exercise performed using these estimates for the 50 states and the United States in the period from 2014 to 2024 are shown in Table 1.
We can use these estimates and the underlying data to answer the questions of what lies behind Wisconsin’s relative growth slowdown and what could be done to reverse it.
Table 1: Growth Accounting for the States
 Source: Center of the American Experiment
1) Growth Accounting
“Growth accounting” breaks down the observed rates of change in real per capita GDP into the shares derived from changes in human capital, physical capital, or TFP.
Table 2 presents the results of our growth accounting exercise for Wisconsin and the United States, broken down into three periods: the entire period which our estimates cover, 2008-2024 in Row 1; the subperiod where Wisconsin’s per capita GDP growth broadly matched that of the United States, 2008-2014, in Row 2; and the subperiod where it lagged it consistently, 2014-2024, in Row 3, which match Table 1. It shows the mean annual growth rates of per capita GDP growth in Columns 1 and 5; the mean (weighted) annual rates of per capita human capital growth in Columns 2 and 6; the mean (weighted) annual rates of per capita physical capital growth in Columns 3 and 7; and the mean annual rates of per capita TFP growth in Columns 4 and 8.[4]
Table 2: Growth Accounting for Wisconsin and the United States
 Source: Center of the American Experiment
The long run
Over the period 2008 to 2024, Wisconsin’s average annual rate of per capita GDP growth—1.0 percent—was below that of the United States generally, 1.4 percent. There was no per capita increase in human capital over this period, either in Wisconsin or nationally. The average annual rate of per capita physical capital growth in the state—0.4 percent—was slightly below the national rate—0.5 percent—and contributed 40.0 percent of Wisconsin’s per capita GDP growth over this period, compared to 39.4 percent for the United States. The state’s annual average rate of TFP growth per capita—0.6 percent—was, again, below the national rate—0.8 percent—and contributed 60.0 percent of the state’s per capita GDP growth compared to 57.5 percent for the United States.
Over the long period, then, the composition of per capita GDP growth in Wisconsin matches that of the United States generally very closely. Both derive the same shares of growth from human capital, physical capital, and TFP, but the United States saw a higher rate for those—physical capital and TFP—which did grow.
The slowdown
To explain the change in performance between the sub periods 2008-2014 and 2014-2024 seen in Figure 1, we need to compare the second and third rows of Table 2.
Wisconsin’s slowdown was only relative. Between 2008-2014 and 2014-2024, the average annual rate of per capita GDP growth in the state rose from 0.9 percent to 1.1 percent, an increase of 0.2 percentage points. For the United States generally, however, the rate rose from 0.6 percent to 1.9 percent, an increase of 1.3 percentage points. While Wisconsin led the national average on per capita GDP growth in our first subperiod, it lagged behind in the second, despite its own rate increasing.
None of Wisconsin’s increased per capita GDP growth rate came from an increase in the rate of per capita physical capital growth. Over the whole period and in both subperiods, the state’s average annual per capita physical capital growth rate was 0.4 percent. The United States generally, however, saw its rate increase, from 0.3 percent average annual growth in 2008-2014 to 0.7 percent in 2014-2024. Again, while Wisconsin led the United States’ growth rate in 2008-2014, it lagged behind in 2014-2024.
The increase in Wisconsin’s rate of per capita GDP growth between 2008-2014 and 2014-2024 came, then, from increased rates of per capita human capital and TFP growth.
About two-thirds of the increase in per capita GDP growth in Wisconsin came from an increased rate of per capita human capital growth. While this declined at an average annual rate of -0.1 percent in 2008-2014, it increased by 0.1 percent in 2014-2024. The United States generally also saw an increase, from a decline of -0.2 percent annually to growth of 0.2 percent, a rise of 0.4 percentage points. Once again, while Wisconsin led the United States’ growth rate in 2008-2014, it lagged behind in 2014-2024.
The remaining third of the increase in per capita GDP growth in Wisconsin came from an increased rate of per capita TFP growth. The average annual growth rate of TFP in the state rose from 0.5 percent in 2008-2014 to 0.6 percent in 2014-2024. But, again, the United States generally saw a steeper increase, from 0.5 percent to 1.0 percent. We see again that, while Wisconsin led the United States’ growth rate in 2008-2014, it lagged behind in 2014-2024.
In 2008-2014, Wisconsin’s rates of per capita human and physical capital growth were higher—or the rates of decline slower—than the rates for the United States, and the rate of TFP growth was the same. As a result, the state had a higher rate of per capita GDP growth than the nation. After 2014, however, the United States’ rates for each component rose above those of Wisconsin, and the state’s per capita GDP growth rate fell below the nation’s as a result.
What explains these changes in the growth rates of the components of per capita GDP growth, which, in each case, went from matching or outperforming the national rate to lagging it? We can use the data that underpin our estimates of human and physical capital to examine more closely the causes of the decline in Wisconsin’s relative performance in real per capita GDP growth.
2) Human Capital
First, we will look at “human capital,” which is the quantity and quality of the labor performed in an economy.
We estimate the total stock of human capital in each state (H) by multiplying the number of people employed (E) by the average number of hours each worker works annually (hours), by the average human capital—or skills—possessed by each worker arising from education (eEduc), by the average skills each worker possesses arising from experience (eExp). The first two components—employment and hours—can be thought of as “raw labor,” and the second two—skills arising from education and experience—as “knowledge capital.”[5]
We then divide this total stock by the population (N) to derive a per capita number (h). Mathematically, if we use the growth rate of employment as a share of the population (E/N) along with the growth rates for hours and skills, we can break down the growth rate of human capital per capita () into its components. Finally, we can take this a step further and decompose changes in the employment ratio into those coming from changes in employment (E) or population (N) as in the following equation:
Table 3 breaks down the unweighted growth rates of Wisconsin’s and the nation’s per capita stocks of human capital into the shares derived from the raw labor and knowledge capital components. What is immediately obvious is that the 0.4 percentage point increase in the average per capita growth rate of human capital in the state from 2008-2014 to 2014-2024—from a decline of -0.2 percent annually to growth of 0.2 percent—is entirely the result of increases in the growth rates of employment and experience per worker. For the other components, average hours worked annually and education per worker, the state’s performance deteriorated. This was also the pattern at the national level.
Table 3: Growth Accounting for Wisconsin, Human Capital
 Source: Center of the American Experiment
Raw Labor
Hours
One component of “raw labor” is the number of hours the average worker works per year.
The growth rate of average hours worked annually slumped from 0.4 percent in 2008-2014 to a decline of -0.1 percent in 2014-2024, which is a negative in our human capital calculation, acting as a headwind to the growth of per capita human capital. It also accounts for some of Wisconsin’s slippage relative to the United States, which went from lagging the state in 2008-2014 to leading it in 2014-2024.
However, fewer hours worked may mean more hours doing something else we enjoy more. Borjas notes that “the typical person employed in production worked 55 hours per week in 1900, 40 hours in 1940, and just under 34 hours in 2020” and argues that this is because, as wages have risen, the “income effect reduces hours of work” as workers can maintain their level of income while working fewer hours. This allows them to purchase more leisure time.[6] The ultimate aim of economic policy is to maximize utility—“a measure of happiness or satisfaction”[7] —not GDP or even GDP per capita, which is a means to that end.
With this in mind, and despite its importance, analysis of average hours worked will be included only as necessary for the growth accounting exercise. At any rate, even with this decline in 2014-2024, Wisconsin’s workers, on average, worked the 19th most hours out of any state in 2024.
Employment
The second component of “raw labor” is the number of people working.
Performance
To analyze changes in per capita economic growth derived from changes in employment, what matters is the share of a given population that is working: the employment ratio. GDP per capita is simply:
Increasing employment by increasing the number of workers, as with immigration, increases both the numerator (GDP) and the denominator (population) in our equation. Whether the increase in GDP is greater than the increase in population so that GDP per capita increases depends on two things: the propensity of the immigrants to be employed relative to that of workers already present, and their skills relative to those of the workers already present. Depending on the specific numbers, the effect on GDP per capita can be either positive or negative. For per capita growth, what is required are skilled workers.
Table 3 shows that, in 2008-2014, Wisconsin’s population increased at an average annual rate of 0.4 percent while employment fell by -0.1 percent annually. As a result, the employment ratio fell by -0.5 percent annually. In 2014-2024, the state’s rate of population growth fell to 0.3 percent while employment growth surged to 0.5 percent so that the employment ratio rose by 0.2 percent annually. Even so, this was another area where Wisconsin lost a lead over the United States between our two subperiods.
Between 2008-2014 and 2014-2024, Wisconsin’s record on job creation improved while population growth edged down. The result was an increase in the employment ratio and a positive contribution to per capita human capital and GDP growth between our two subperiods, but a deterioration relative to the United States.
Prospects
Wisconsin has less scope to drive faster per capita GDP growth from employment growth than most states.
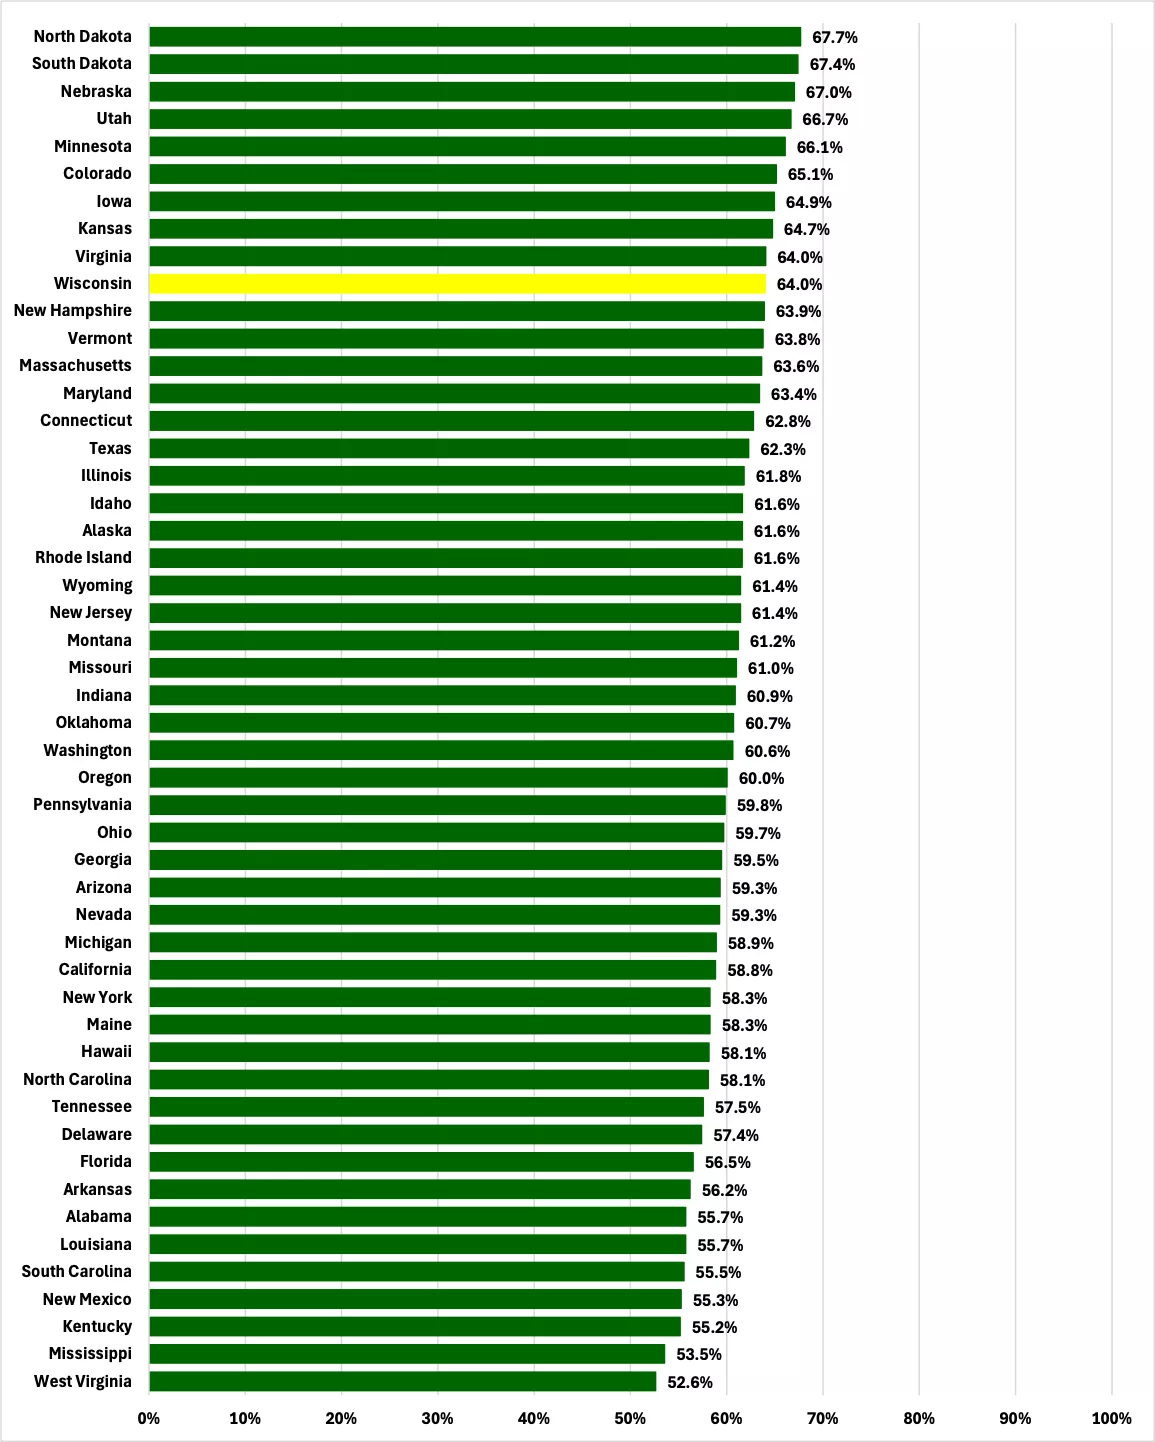
As Figure 4 shows, in 2024 Wisconsin had 64.0 percent of its civilian non-institutional population[8] employed, the 10th highest rate in the country. While there is scope for a state like West Virginia to drive faster per capita GDP growth from a higher employment ratio, that scope is more limited, though not entirely absent, in Wisconsin. Unemployment rates vary across demographics, and where those rates are low, increasing them will be an economic win for the state.
Figure 3: Average Annual Rate of Employment Ratio Change
 Source: Bureau of Labor Statistics and Center of the American Experiment
Figure 4: Employment as a Share of the Civilian Non-Institutional Population, 2024
 Source: Bureau of Labor Statistics and Center of the American Experiment
Knowledge capital
There is an upper limit to how much per capita GDP growth can be derived from increasing the “raw labor” inputs. Once everybody is employed, there can be no further growth from increased employment. If everyone is working 24 hours a day and seven days a week, there can be no further growth from increased hours. Ultimately, per capita economic growth comes not from increasing the amount of work but from increasing the productivity of each unit of work.
In terms of human capital, it means increasing a worker’s skills. Given that these embody knowledge, for which there is no obvious upper limit, the growth we can derive from them also has no obvious upper limit. These skills can be increased either through education or experience.
Education
The first component of “knowledge capital” is the skills the average worker possesses arising from his or her education.
Performance
Table 3 shows that the per worker stock of human capital—or skills—arising from education in Wisconsin increased at an average annual rate of 0.2 percent in the 2008-2014 period, but this slipped to 0.1 percent in 2014-2024, shaving 0.1 percentage points off the rate of per capita human capital growth. While the state matched the national rate in our first subperiod, the United States maintained its rate of growth across our two subperiods at 0.2 percent so lead Wisconsin in 2014-2024. This accounts for some of Wisconsin’s slippage in per capita human capital and GDP growth relative to the United States.
We measure the per worker stock of human capital arising from education by dividing the workforce into categories based on educational attainment, awarding each category a score that increases with the level of attainment, multiplying that by the number of workers in each category, then summing the totals for all categories. We then divide this total stock by the number of workers for the per worker number (eEduc). It follows that if the composition of the workforce by educational attainment changes, so will the stock of human capital arising from education per worker.
It is true that many workers without college degrees have more economically useful skills than many holders of PhDs. Nevertheless, on average, economists have found that each year of schooling tends to raise a worker’s wage by a certain percentage,[9] reflecting increased skills.
In Figure 5 we see that, between 2008 and 2014, the share of Wisconsin’s workforce with at least a bachelor’s degree rose by 4.0 percentage points. This was a greater increase than the United States—3.1 percentage points—and ranked 7th out of 50 states. Between 2014 and 2024, however, that share rose by 5.2 percentage points in Wisconsin compared to 6.3 percentage points nationally, a rate that ranked 35th out of 50 states.
Between our two subperiods, the per worker growth rate of human capital arising from education fell in Wisconsin, in both absolute and relative terms. This lowered the rate of human capital formation and per capita GDP growth.
Prospects
Wisconsin has scope to drive higher rates of per capita GDP growth from increased education.
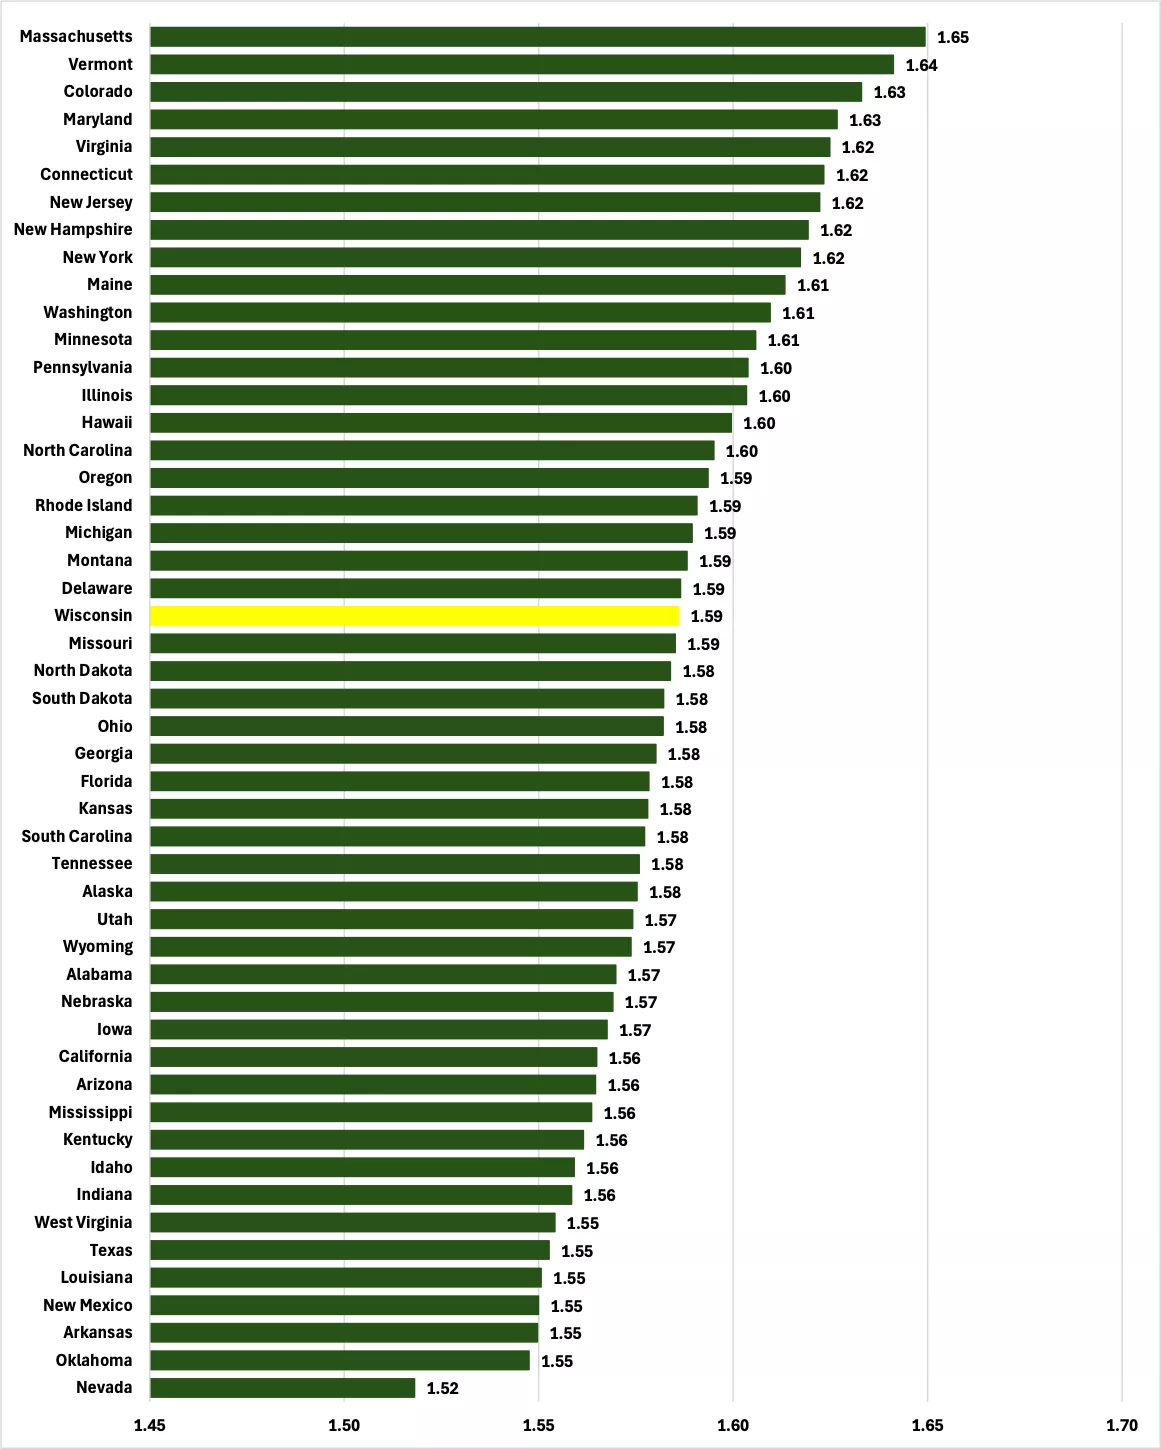
Figure 6 shows that Wisconsin’s workers scored an average of 1.59 for human capital arising from education in 2024, which was lower than 21 other states. With only 35.7 percent of the state’s workers possessing a bachelor’s degree or above, a share below 29 other states and the United States’ figure of 39.3 percent, this is an area where the state can look for faster growth.
Figure 5: Percentage Point Change in Share of Workforce With at Least a Bachelor’s Degree
 Source: Census Bureau, Bureau of Labor Statistics, and Center of the American Experiment
Figure 6: Human Capital Arising from Education Per Worker, 2024
 Source: Census Bureau, Bureau of Labor Statistics, and Center of the American Experiment
Experience
The second component of “knowledge capital” is the skills the average worker possesses arising from their experience.
Performance
Table 3 shows that the per worker stock of human capital—or skills—arising from experience in Wisconsin fell at an average annual rate of -0.3 percent in 2008-2014, which ranked 29th out of 50 states. This rate improved in 2014-2024 by stagnating, but this still brought an improved ranking of 23rd. This improvement in the per worker growth of the human capital arising from education contributed 0.3 percentage points to the increased rate of per capita human capital growth. This is an area where Wisconsin did not lose ground to the United States between our two subperiods.
We measure per worker human capital arising from experience by dividing the workforce into categories based on age and awarding each category a score. These scores increase with age up to a point, then decline as workers become “set in their ways,” and experience becomes a negative; in our calculations, human capital per worker increases up to the age of 44 and declines thereafter. We then multiply each category’s score by the number of workers in each category, sum the totals for all categories, and divide this total stock by the number of workers for the per worker number (eExp). It follows that if the composition of the workforce by age changes, so will the stock of human capital arising from education per worker.[10]
That is what we see in Figure 7. Between 2008 and 2014, the share of Wisconsin’s workforce aged under 45—where per worker skills are rising—declined by -2.9 percentage points, a performance worse than that United States—a decline of -2.2 percentage points—which ranked 36th out of 50 states. From 2014 to 2024, however, this share increased by 2.4 percentage points, which was better than the national increase of 1.2 percentage points, a performance which ranked 14th out of 50 states.
When it comes to per worker skills arising from experience, Wisconsin improved both its rate and its ranking between the two subperiods as the younger share of its workforce grew at a relatively respectable rate. This boosted the growth rates of human capital and per capita GDP.
Prospects
Wisconsin has scope to generate faster rates of per capita GDP growth from higher levels of experience per worker.
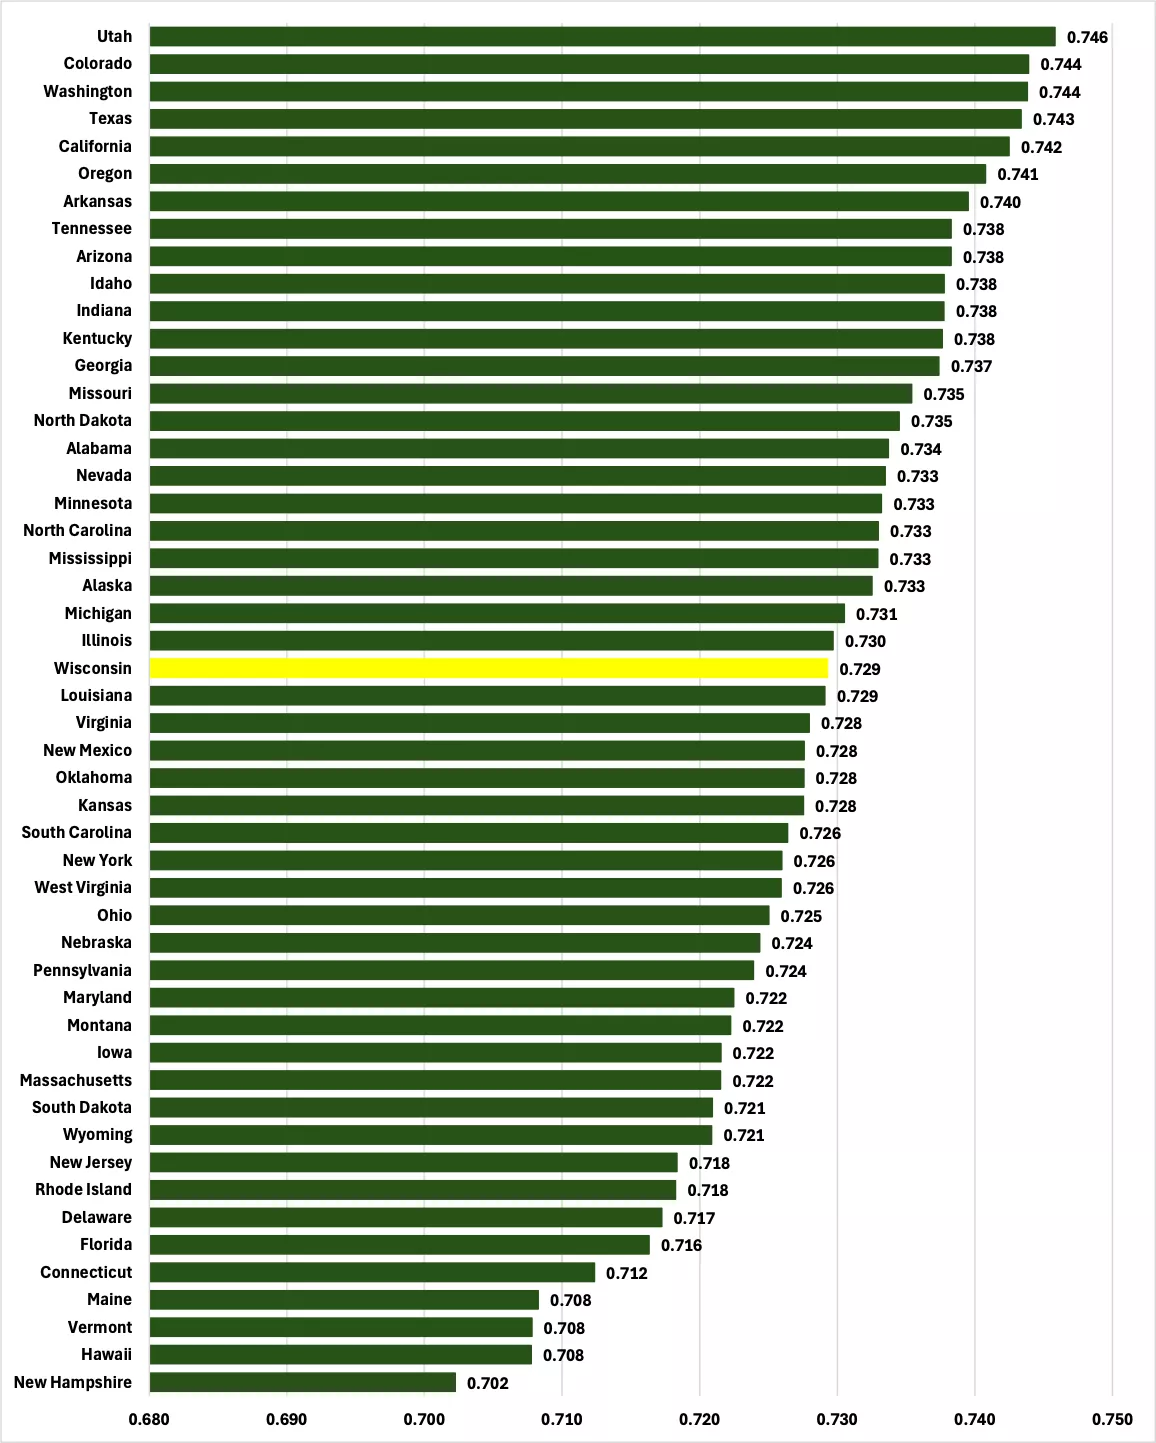
Figure 8 shows that Wisconsin’s workers scored an average of 0.73 for human capital arising from experience, which was lower than in 23 other states. With its share of its workforce under 45 ranking 28th out of the 50 states, Wisconsin can look for growth here, but will need to attract younger residents.
Figure 7: Percentage Point Change in Share of the Workforce Under 45
 Source: Bureau of Labor Statistics and Center of the American Experiment
Figure 8: Human Capital Arising from Experience Per Worker, 2024
 Source: Bureau of Labor Statistics and Center of the American Experiment
Human capital revisited
An increase in the per capita human capital growth rate in Wisconsin contributed about two thirds of the increase in the state’s per capita GDP growth rate between our two subperiods, 2008-2014 and 2014-2024. Even so, this improvement was not so impressive as that for the United States generally and contributed to the state’s relative slowdown.
The improvement in Wisconsin’s per capita human capital growth rate was driven entirely by increases in employment growth relative to population growth between the two subperiods and in an increase in the growth rate of per worker’s skills derived from experience. The growth rate for the other two sources, average hours worked and skills from education, declined and were headwinds to human capital and GDP growth.
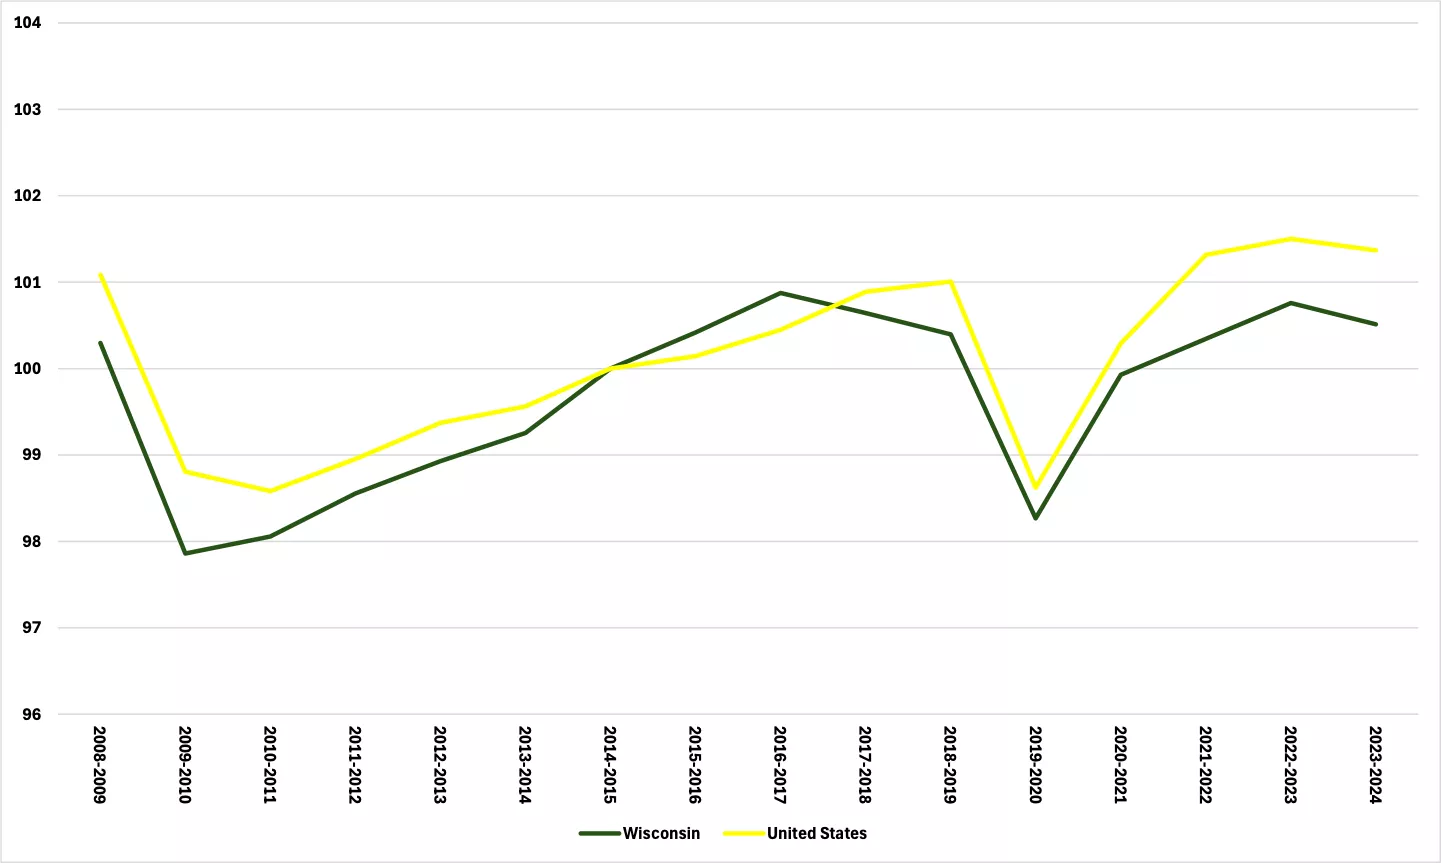
Figure 9 shows that Wisconsin’s unweighted growth rate of per capita human capital has broadly tracked that of the United States over the long period since 2008. Indeed, as late as 2017, the state had outperformed the nation, but since then its relative performance has deteriorated. To improve this performance by growing human capital, Wisconsin will need to boost the knowledge capital of its workers.
Figure 9: Change in weighted human capital per capita, 2014 = 100
 Source: Center of the American Experiment
3) Physical Capital
Now, we turn to look at “physical capital,” which is the tools these workers have to work with.
We estimate the total stock of physical capital in each state by taking the physical capital stock in each industry in the United States and then apportioning that between the states according to each state’s share of each industry’s GDP and summing across the industries for each state.
Table 2 shows that the per capita growth rate of physical capital in Wisconsin remained constant over our whole period 2008 to 2024 and in our two subperiods at 0.4 percent annually. It played no role in the increase in per capita GDP growth between the two subperiods. The United States, however, saw its rate climb from 0.3 percent annually in 2008-2014 to 0.7 percent annually in 2014-2024, so the state lost ground to the nation here.
The difference between the total population of a state and the number of people employed in it varies widely across the United States. This might reflect higher rates of employment in a state, or it might reflect demographics, specifically differing shares of the population under 16 or over 65. If either of these shares grow, physical capital could fall in per capita terms even if businesses were investing and increasing capital per worker. To isolate the growth of physical capital per worker (eK), we can subtract the rate of employment ratio (E/N) growth from the rate of per capita physical capital (nK) growth.
Performance
Figure 10 shows the (unweighted) average annual growth rate of the per worker physical capital stock for the 50 states in two periods.
In 2008-2014, Wisconsin recorded an average annual growth rate of 1.9 percent, ahead of the United States' 1.8 percent rate and ranking 19th out of 50 states. In 2014-2024, Wisconsin’s rate tumbled to 1.0 percent, ranking 38th out of 50 states, while the United States’ rate only edged down to 1.7 percent. Wisconsin’s rate of per worker physical capital growth slowed both relatively and absolutely between our two periods.
Figure 10: Average Annual Growth Rate of Physical Capital Per Worker
 Source: Bureau of Economic Analysis, Bureau of Labor Statistics, and Center of the American Experiment
Given different capital intensities across industries, the amount of capital per worker can change in a state or nation relative to another for one of two reasons. First, the amount of capital per worker in a given industry might increase/decrease more in one jurisdiction than in another. Second, employment might grow more in more capital-intensive industries in one jurisdiction than in another.
Figure 11 shows the difference in the average annual rate of per worker capital growth in Wisconsin and the United States in each of the periods 2008-2014 and 2014-2024 and the average stock of capital per worker in each sector for the period 2008-2024. We see that Wisconsin’s average rate of per worker capital growth in the “Real estate and rental and leasing” sector lead the United States’ rate by 0.8 percentage points in 2008-2014 (2.8 percent annually versus 2.0 percent) but lagged it by 1.4 percentage points (0.2 percent annually versus 1.6 percent) in 2014-2024. Given that the average stock of capital per worker in this sector in Wisconsin over the period 2008-2024 was $11,820, making it the most capital-intensive sector, this played a role in the state’s relative growth slowdown.
Figure 11: Difference in average annual per worker capital growth by sector, Wisconsin and United States, percentage points
 Source: Bureau of Economic Analysis, Bureau of Labor Statistics, and Center of the American Experiment
Figure 12 shows the difference in the average annual rate of employment growth in Wisconsin and the United States for two the periods 2008-2014 and 2014-2024 and the average stock of capital per worker in each sector for the period 2008-2024. We see that Wisconsin actually improved its performance relative to the United States between the two subperiods in two of the three most capital-intensive sectors; “Mining” and “Real estate and rental and leasing,” the most capital intensive of all.
Figure 12: Difference in Average Annual Employment Growth by Sector, Wisconsin and United States, Percentage Points
 Source: Bureau of Economic Analysis, Bureau of Labor Statistics, and Center of the American Experiment
Taken together, Figures 11 and 12 suggest that Wisconsin’s slowdown in per worker capital growth both in absolute and relative terms was more the result of slowing investment per worker than a shift in employment growth away from more capital-intensive sectors.
Prospects
There is ample scope for Wisconsin to drive faster per capita GDP growth from increasing the growth rate of physical capital.
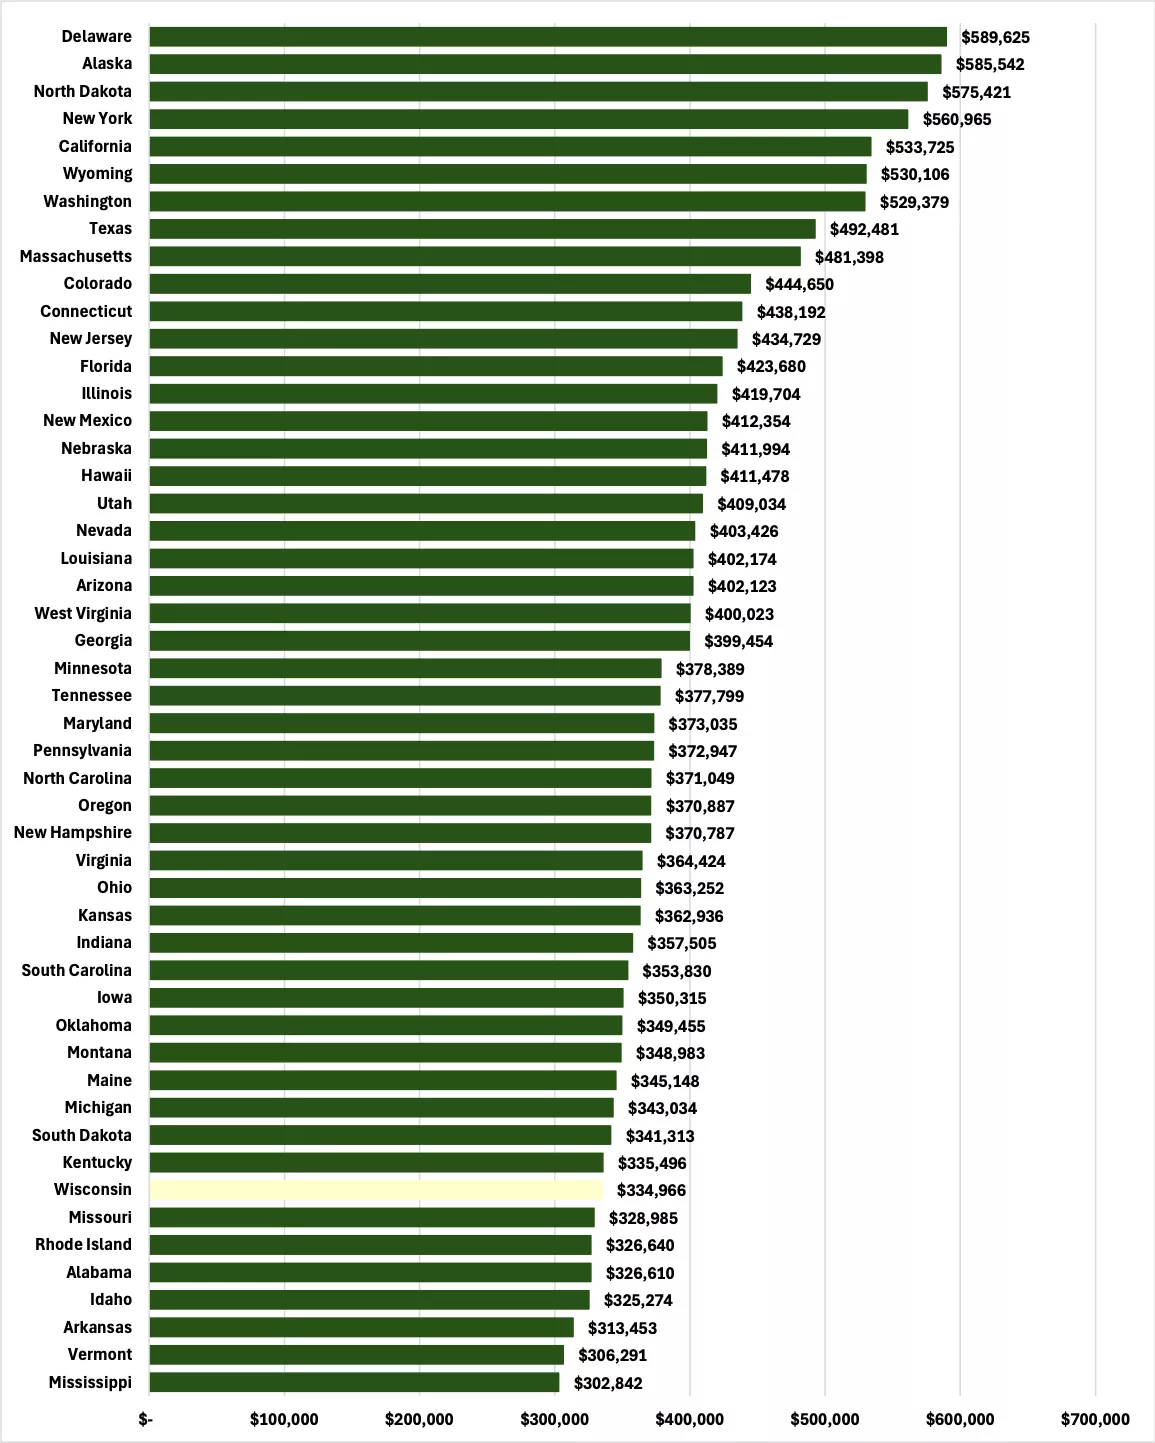
The state’s stock of physical capital per worker is lower than in all but seven other states, as Figure 13 shows. Here, too, there is no theoretical upper bound, so Wisconsin should adopt policies to encourage capital investment to see a greater contribution to per capita GDP growth from this source.
Figure 13: Physical Capital Per Worker, 2024, (2017$)
 Source: Bureau of Economic Analysis and Center of the American Experiment
Physical capital revisited
The stability of Wisconsin’s per capita physical capital growth rate of 0.4 percent means that it contributed nothing to the increased GDP growth rate seen between 2008-2014 and 2014-2024. It did, however, account for some share of the slippage relative to the United States, which saw its rate increase from 0.3 percent to 0.7 percent.
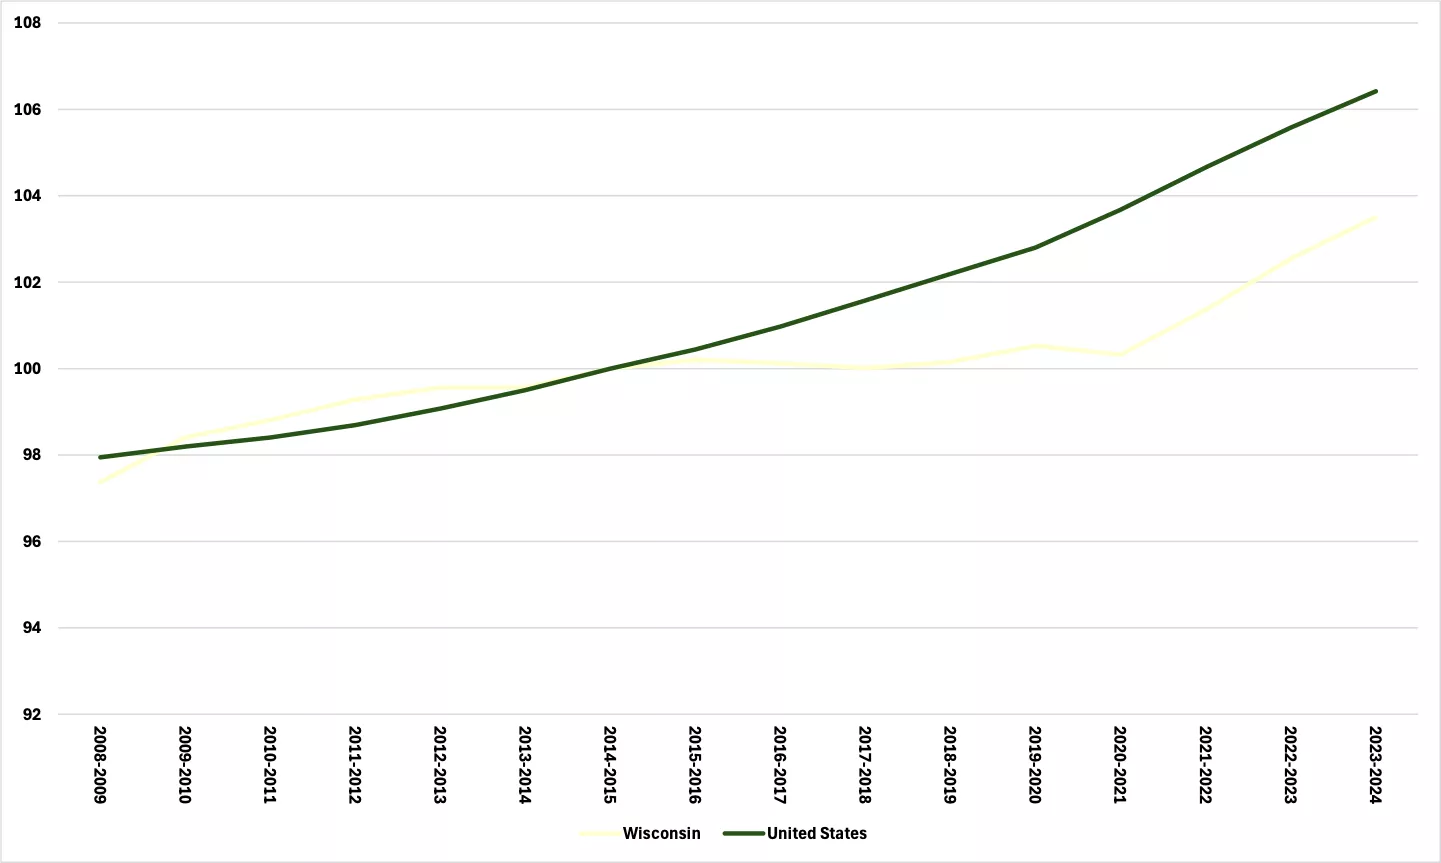
There is some variation in this story as well. As Figure 14 shows, Wisconsin’s unweighted growth rate of per capita physical capital traced that of the United States closely up to 2015 but then flatlined until 2021. While the state has matched the national rate of growth since then, it has not made up the ground lost between 2015 and 2021. To close this gap, the state will need to adopt policies which encourage more capital investment.
Figure 14: Change in Weighted Physical Capital Per Capita, 2014 = 100
 Source: Center of the American Experiment
4) Total Factor Productivity
Finally, we look at Total Factor Productivity (TFP), which is the effectiveness with which factors of production, like labor and capital, are converted into output. It is also known as Technology and can be loosely thought of as a measure of entrepreneurship and innovation.
Wisconsin’s rate of TFP Growth picked up between 2008-2014 and 2014-2054 from 0.5 percent annually to 0.6 percent, and this contributed one-third of the increase in the state’s per capita GDP growth rate. At the same time, however, the United States saw its rate rise from 0.5 percent to 1.0 percent, and its ranking fell from 21st out of 50 states in 2008-2014 to 38th in 2014-2024. Wisconsin lost ground, relatively speaking, which accounts for some of its relative slowdown.
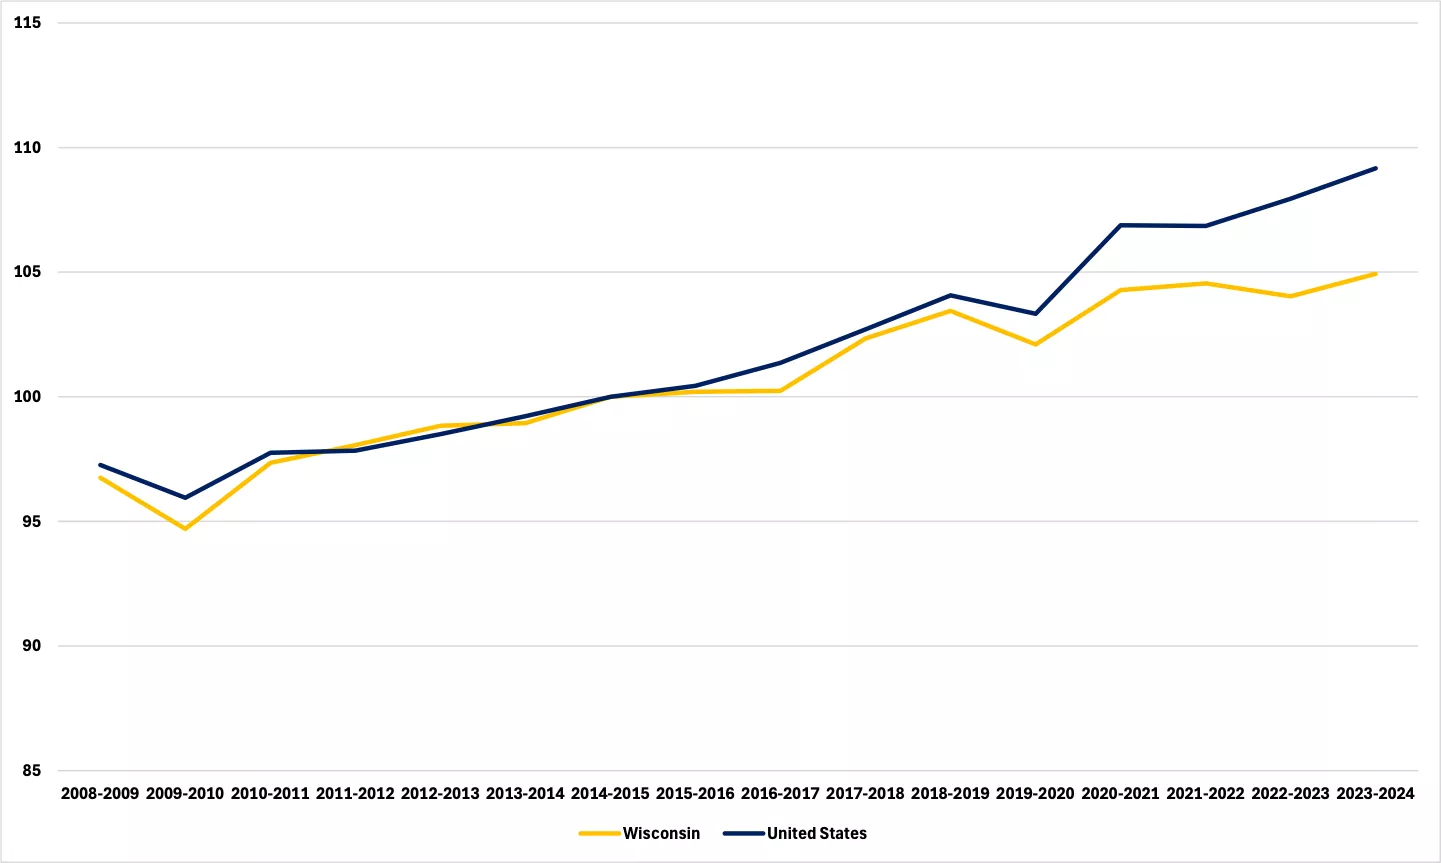
As Figure 15 shows, between 2008 and 2019, Wisconsin tracked the United States fairly closely in TFP Growth. After that, however, while the state’s growth continued, it began to lag the national rate. To close this gap, the state will need to enact policies that encourage entrepreneurship and innovation.
Figure 15: Change in Total Factor Productivity Per Capita, 2014 = 100
 Source: Center of the American Experiment
5) Conclusion: Performance and Prospects
We began by noting that, after largely matching the United States’ generally for per capita GDP growth prior to 2014, Wisconsin has subsequently lagged in every year since. The result is that the state’s per capita GDP has fallen from 93.6 percent that of the United States in 2014 to 86.6 percent in 2024.
This happened while Wisconsin’s average annual rate of per capita GDP growth increased, from 0.9 percent to 1.1 percent. However, the United States saw its growth rate rise from 0.6 percent to 1.9 percent, so the state’s growth slipped relatively.
One third of the increase in Wisconsin’s per capita GDP growth rate between the two periods came from a higher per capita rate of human capital growth, from a decline of -0.1 percent annually to growth of 0.1 percent. This, in turn, was driven by increases in the employment ratio as employment grew faster than the population and the per-worker skills arising from experience. Growth in average hours worked and per worker skills derived from education declined and acted as headwinds to human capital and per capita GDP growth in the state between the two periods. Even with the increased rate of growth, however, Wisconsin lost ground to the United States, which saw its rate of human capital growth rise from a decline of -0.2 percent annually to growth of 0.2 percent. This, then, accounts for some portion of the state’s relative slowdown.
The remaining third of the increased rate of per capita GDP growth came from faster TFP growth. This increased from 0.5 percent annually in 2008-2014 to 0.6 percent annually in 2014-2024. However, the United States saw its rate climb from 0.5 percent to 1.0 percent, so this, too, accounted for some portion of Wisconsin’s relative slowdown.
Wisconsin saw no increase in its per capita GDP growth rate arising from a faster rate of per capita physical capital growth. Holding steady at 0.4 percent annually, this led the United States in 2008-2014 and lagged it in 2014-2024, also accounting for some share of the state’s relative slowdown.
Wisconsin has a hardworking population, scoring well on the measures of the “raw” labor components of human capital, employment and hours worked. But these workers, on average, have middling knowledge capital—skills derived from education and experience—compared to other states. In addition, they have relatively little physical capital to work with.
The Badger State’s relative economic malaise is, then, no mystery. Fortunately, with a clear picture of its causes, we can work to find cures.
Endnotes
[1] Martha Njolomole and John Phelan, The State of Minnesota’s Economy: 2020: A focus on economic growth (Center of the American Experiment, 2021): p. 16.
[2] For an explanation of the method of growth accounting used and construction of human and physical capital measures, see John Phelan, Accounting for Growth: Measuring the sources of per capita economic growth at the state level (Center of the American Experiment, 2025).
[3] Center of the American Experiment https://www.americanexperiment.org/american-experiment-united-states-tables/.
[4] Because of rounding, the sum of the values in columns 2, 3, and 4 may not exactly equal to Column 1. The same applies to Table 3.
[5] Eric A. Hanushek, Jens Ruhose, and Ludger Woessmann, “Knowledge Capital and Aggregate Income Differences: Development Accounting for US States,” American Economic Journal: Macroeconomics, Vol. 9, no. 4 (2017): pp. 184-224.
[6] George J. Borjas, Labor Economics (McGraw Hill Education, 2020): pp. 19-75.
[7] N. Gregory Mankiw, Principles of Microeconomics (South-Western Cengage Learning, 2009): p. 508.
[8] Bureau of Labor Statistics, Labor Force Statistics from the Current Population Survey, Concepts and Definitions (CPS), Civilian noninstitutional population, https://www.bls.gov/cps/definitions.htm#population
[9] Dietrich Vollrath, Fully Grown: Why a Stagnant Economy Is a Sign of Success (University of Chicago Press, 2020): pp. 30-31.
[10] Dietrich Vollrath, Fully Grown: Why a Stagnant Economy Is a Sign of Success (University of Chicago Press, 2020): p. 31.
The solution is consistent application of free-market principles so AIDCs can still proceed without taxpayer subsidies or special privileges. The article concludes with five concrete recommendations:
Water Usage: Allow rainwater collection; incentivize and permit on-site industrial water transport, purchase, and storage; raise prices charged by municipal utilities to AIDCs and new large demanders; require AIDCs to fund all new water infrastructure (with side payments to affected locals permitted); and assign property rights to aquifer, river, and lake resources so owners can draw at regulated rates from on-site private wells.
Electricity: Require AIDCs (and any users with ≥10–50 MW demand) to pay for, construct, and own all necessary generation infrastructure on-site. Permit and fast-track private grids independent of utility regulators. Adopt ALEC’s BYOP/CRE (Bring Your Own Power/Consumer Regulated Utilities) initiative and Cato’s private-grid proposals (Travis Fisher). Lucas notes private power can be ~20% cheaper and represents a manageable share of total AIDC costs (especially relative to recurring hardware).
Zoning: Rebuild zoning from first principles around property rights in common resources (air, sound, light) to mitigate pollution externalities. Apply uniform standards within each zone rather than selective favors for AIDCs. Residential expectations of protection against industrial noise/light pollution should hold unless waived by location in mixed-use zones.
Taxes: Abolish Tax Incremental Financing (TIF/TID) districts. These enable local governments to effectively double-tax property owners outside the district to subsidize development inside it without voter approval—a crony transfer that socializes risk while privatizing gains. Large AIDC developers (spending billions on shells and hardware) can afford site preparation themselves.
Subsidies: Ban transfer payments (subsidies) to businesses. Local governments currently subsidize AIDCs via TIF placement and taxpayer-financed “developer reimbursements.” Government’s proper role is to set and enforce neutral rules of fair play, not to pick winners, seek out specific industries, or engage in central planning. Communities seeking growth should first remove obstacles that discourage voluntary development.
In short, Lucas’s market-oriented framework would let AIDCs develop on a level playing field: developers bear their own costs for water, power, site work, and externalities; taxpayers keep their money; and any AI-related gains reflect genuine entrepreneurship rather than political favoritism.

Interested in the content of this Article?
Reach out to the MacIver Institute to aquire more information


