
- Podcasts
 Podcasts
 - Videos
 Videos
 - Policy Issues
 Policy Issues
 - About
 About
About


The Economy From a Bird's Eye View
We're a little more than a year into the "Trump economy" and many Americans are unsure how it's been performing. All the talk of DOGE cutting waste and rooting-out fraud, tariffs and "fair" trade deals, and the ongoing Iran war that has closed? opened? reopened? the Strait of Hormuz has engendered a great deal of economic uncertainty that spans the political divide. Despite reports of a bustling stock market, improving employment conditions and rising wages, many have yet to benefit from these positive developments personally. What's really going on?
One of the first things to consider when trying to get an idea of how the US economy is doing is to look at a few macro and recession indicators. With respect to recession indicators, in particular, the 10Y-3M Yield Curve, The Conference Board's Leading Economic Indicator (LEI), NBER's Business Cycle Dating, University of Michigan's Consumer Sentiment Index, Credit Spreads, and Housing Starts are good launch points to begin an investigation into the current state of the US economy.
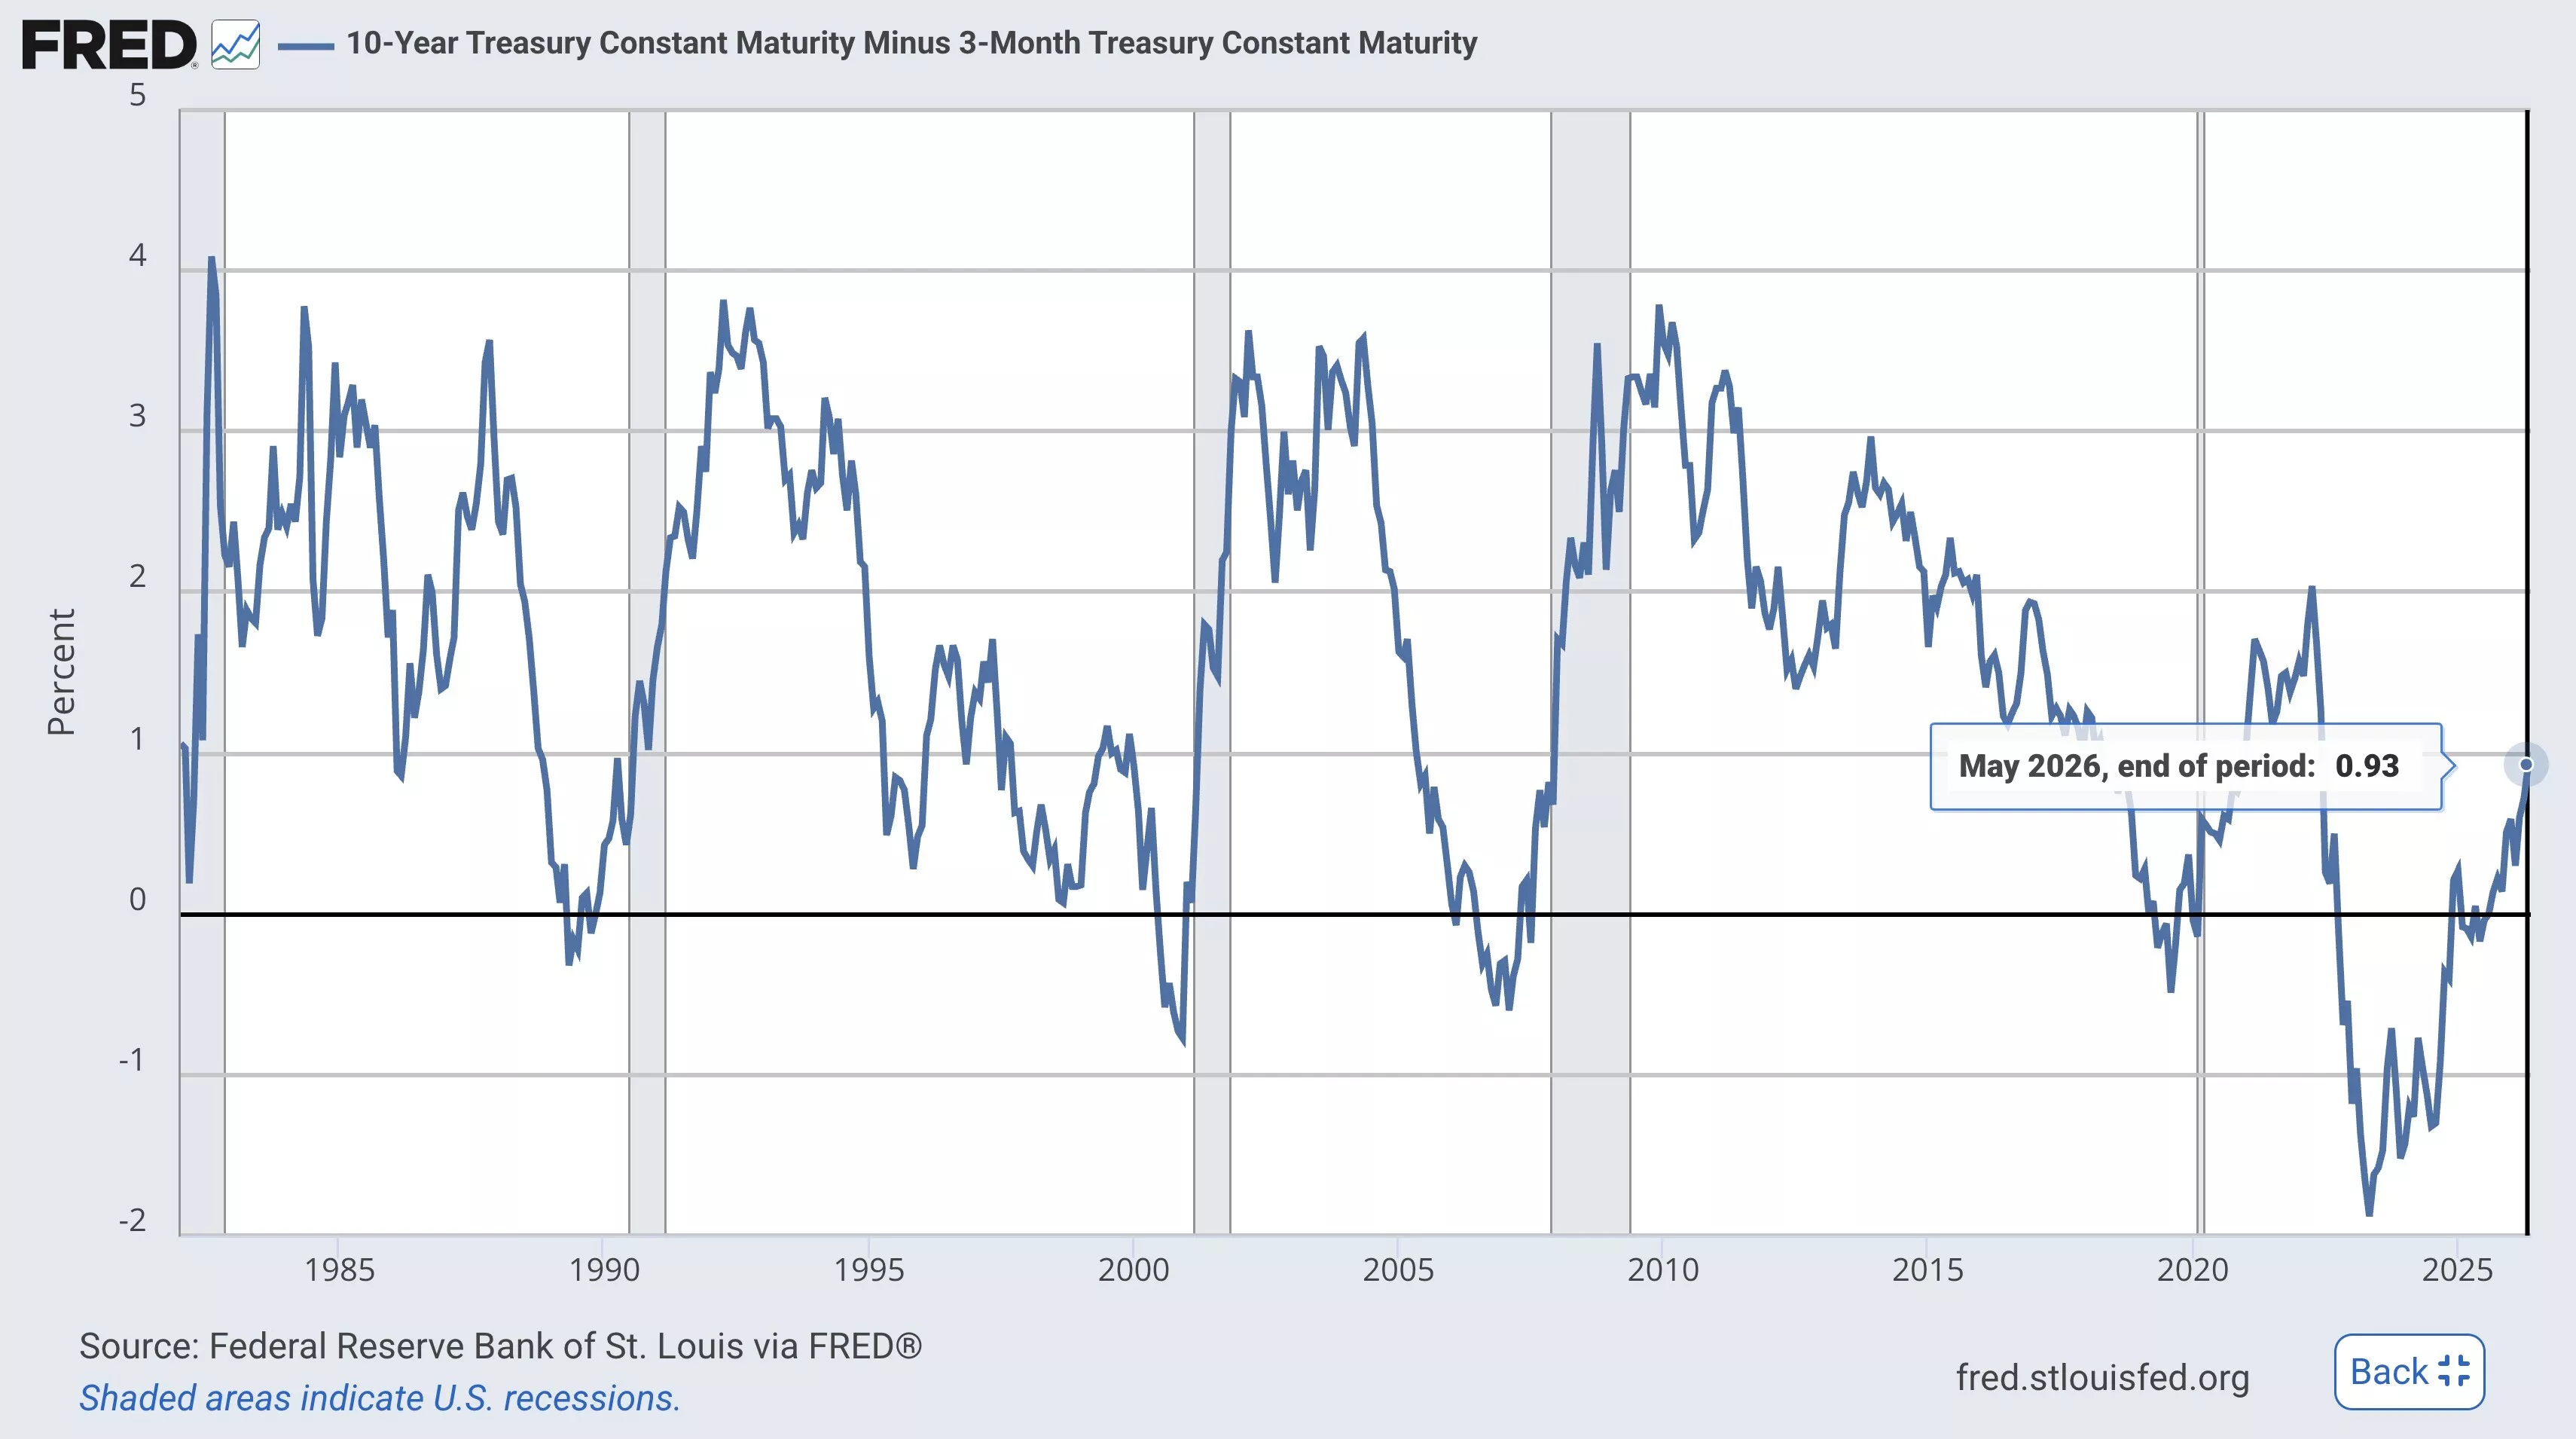
The chart above is one of, if not the, best leading indicators of recession. When the curve falls below zero and remains there, recessions occur within 18 months. This curve inverted for two years between 2022 and 2024, and hovered around zero for most of 2025.
Curiously, notice that the deep, long inversion that occurred between Oct 2022 and Dec 2024 has not resulted in an official recession. But if we look at the LEI (and later at employment and real wages), it corroborates what many people suspected: that the US has been in a recession.
Note: typically we expect that when the Fed sells-off its assets a recession is soon to follow. But at the same time that the Fed was off-loading its balance sheet, it was also selling newly-bought treasuries through its Overnight Reverse Repo facility. The effect of this was to inject $2.5 trillion into the banking sector over a more drawn out period at the same time that it was decreasing its assets by $2.3 trillion. This dampened the inflationary effect of the Fed's QE and effectively ended the stimulus by April 2021.
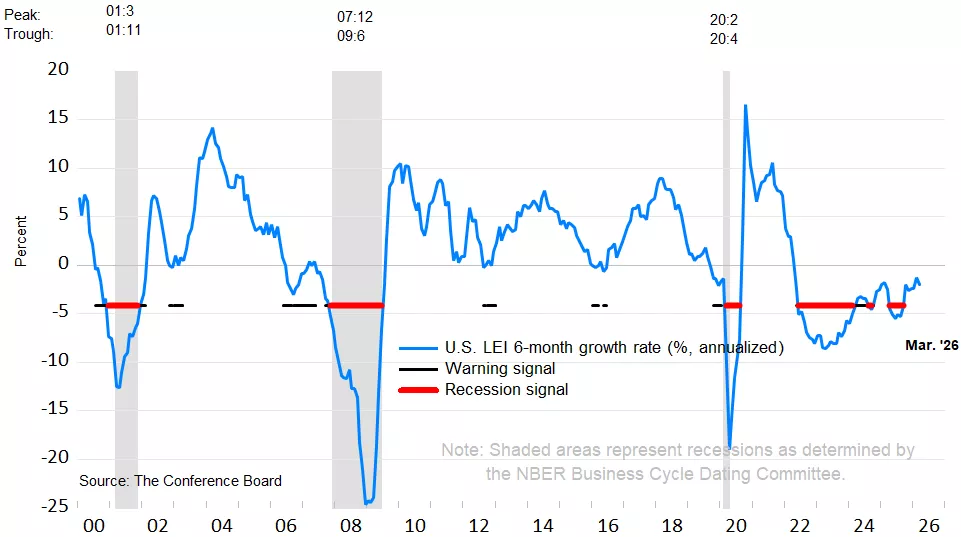
From mid-2022 through January 2026, the LEI suggests that the US was in recession territory for most of that period. Only in the last few months has the indicator climbed out of recession territory, granted it is still below zero percent. However, 2022-2026 isn't considered a recessionary period. And neither was most of the lockdown. This is because the NBER, the private organization that is the "recognized authority" for dating recessions, has "no fixed rule about what measures contribute information to the process or how they are weighted in our decisions."
However, they do explain that there are a number of data sets they frequently consult when determining whether a recession has occurred: "These include real personal income less transfers, nonfarm payroll employment, employment as measured by the household survey, real personal consumption expenditures, manufacturing and trade sales adjusted for price changes, and industrial production."
[click here for chart of NBER data; Ind. Prod. Manufacturing used instead of Ind. Prod. Total]
What this shows is that throughout the 2022-26 period, most metrics show positive growth. The only exception being Manufacturing Production. Household Survey employment data showed meager growth since mid-2022, increasing by only 3%. Of course, the reliability of most of these metrics depends entirely on how good the price inflation indices are. The employment metrics depend on the thoroughness of the surveys and whether the samples are representative. In the next section we will look at employment and wages more closely.
In any case, if we look next at University of Michigan's Consumer Sentiment survey, we can get an idea of whether the economic complaints made by everyday people are representative of the population at large...
 Surveys of Consumers, University of Michigan, University of Michigan: Consumer Sentiment ©, retrieved from https://www.sca.isr.umich.edu/, (Accessed on 5-18-26)
As of May, the CS index reads 50.3––the lowest ever recorded. This is no doubt due to people's cost of living concerns. Inflation (and the subsequent price increases that result) has been the #1 concern of Americans for the last five years, and they rightly feel as if basic necessities like food, energy, and housing are becoming more and more unattainable.
April's CPI: All Items increased to 3.78% YoY, up from last month's 3.29% YoY rate. CPI: Less Food & Energy also increased to 2.74% YoY, up from last month's 2.60% YoY rate. By removing energy from the CPI, we can see that rising out-of-pocket energy costs due to the global reduction in oil supply has had a knock-on effect for downstream factors of production. In April, the CPI for energy increased to 17.54% YoY, up from March's 12.59% YoY rate, and much higher than February's 0.40% YoY rate.
The last bird's eye metric to consider is housing. For our purposes, the number of housing starts and completions per household, the housing expense ratio, and time to sell are all relevant.
First, housing starts and completions are higher than their all-time low in 2011, but still below the 58-year average of 1.5%.
When it comes to affordability, housing expenses are near all-time highs. Today, the median home is more than 5 times the median household income. In 1985, that ratio was just 3.5.
As for housing supply, the monthly supply of new houses (not existing homes) tells us how long it would take for all new homes to sell. Notably, when the months' supply of houses reaches 10, this marks the beginning of a recession. The only false positive occurred in July 2022, the beginning of the same period identified by the LEI that normally would have identified a recession.
In January of this year the months' supply reached 9.8. In March, it fell to 8.5.
National Employment & Wages
Headline unemployment (U-3) has been steadily rising since April 2023 when unemployment was a very low 3.4%. As of April this year, unemployment has risen to 4.3%.
We typically expect the natural rate of unemployment to be between 3 and 4%, but a longstanding trend of falling labor force participation fails to put this figure into proper context.
While the Establishment survey has shown rather meager gains in employment over the last two years, the much more accurate Household survey tells a different story. When broken down between native and foreign born workers, employment levels for native born workers is well-below pre-pandemic trends, and as of April showed 589,000 fewer native workers employed than in October 2019. On the flip side, foreign born workers have caught back up to their pre-pandemic trend, and have gained more than 4.3 million jobs.
If we look at the change in full and part time employment, we see that the number of people working part time has increased since Trump took office in January 2025, while full time work has declined. This explains in large part the reason why people report harder economic conditions: wages may have risen in real terms, but if people have to resort to part time work because full time work isn't available, total income falls.
However, when we do look at inflation-adjusted wages, the data are mixed but suggest that real wages since January 2021 have fallen.
According to the Household survey (green line), real wages for private sector employees as of Q1:2026 are up by .8% since January 2021 (note that Q1:2026 does not display on the chart unless you hover over the date).
As for the other two series from the Establishment survey, real average hourly earnings of private sector employees (blue line) are 1.2% lower than they were in January 2021, and wages and salaries of private sector employees (purple line) as of Q1:2026 were 1.3% lower.
WI Employment
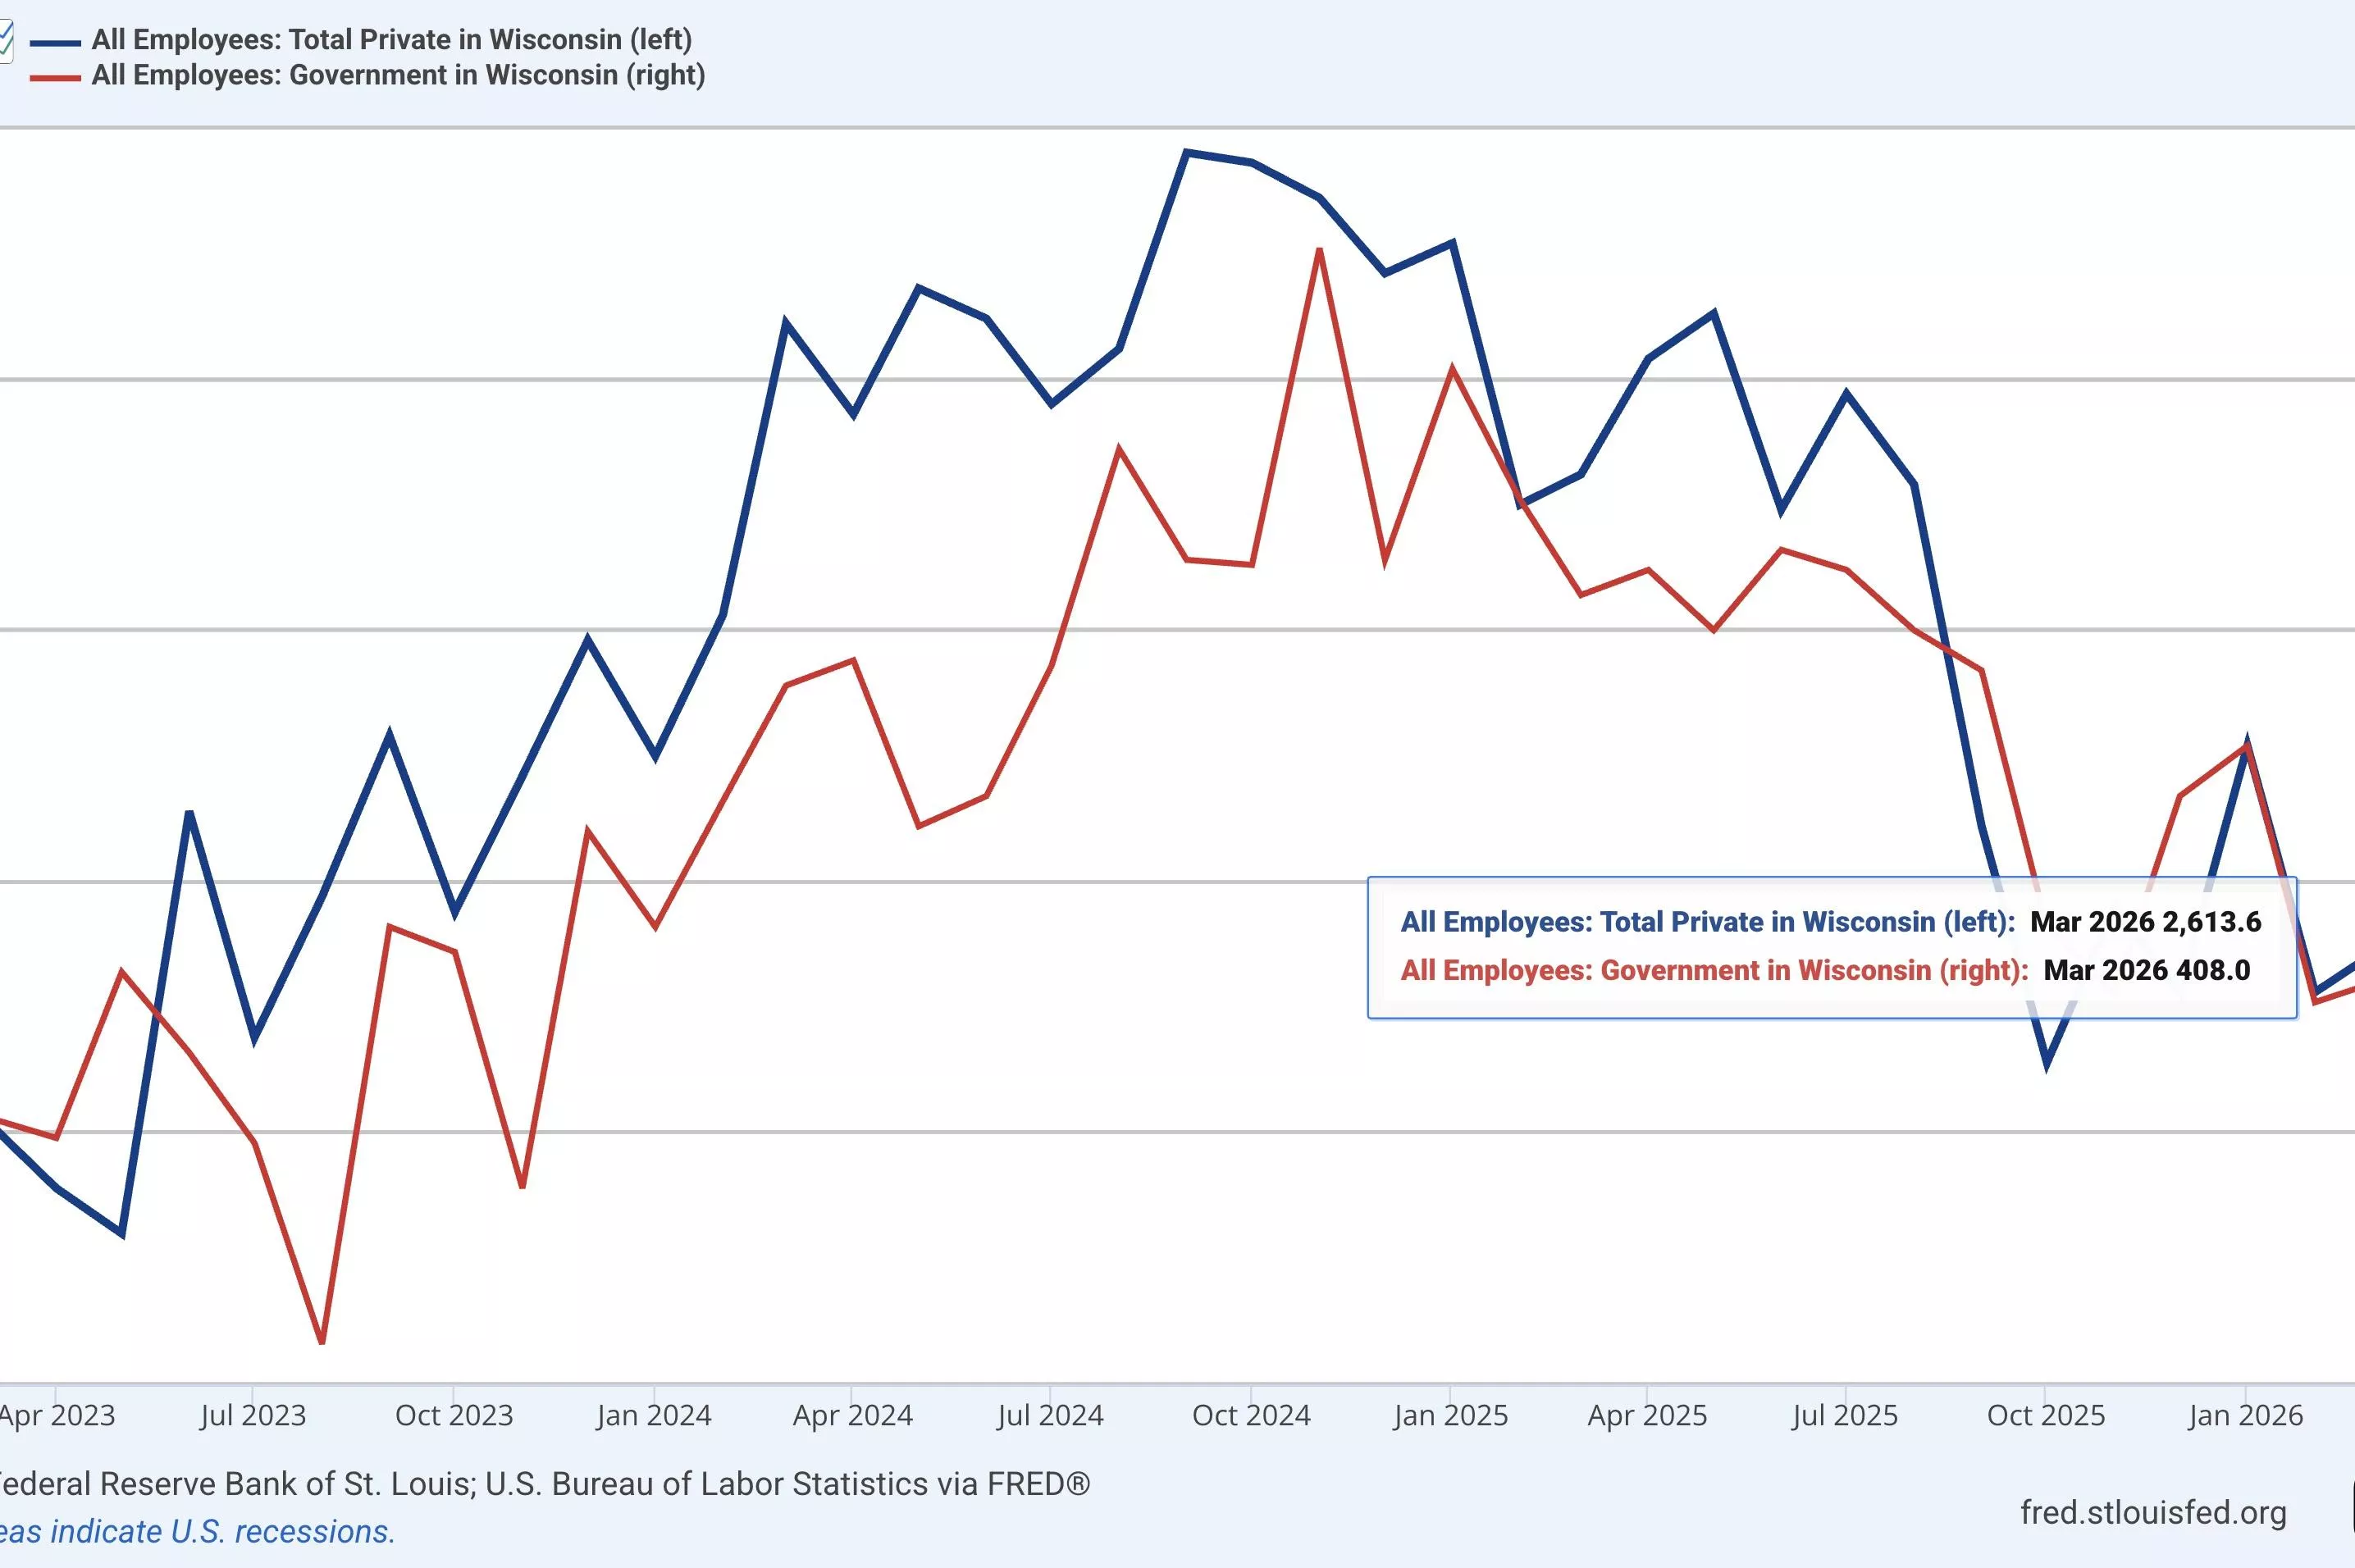
Much of what we've discussed above applies to Wisconsin's economy. With respect to private sector employment, Wisconsin is still well below pre-pandemic trends, but above pre-pandemic levels.
However, since late 2024 both public and private sector employment have been falling. Private employment is down by ~16,000 jobs since September 2024 and public employment has fallen by ~8,400 jobs. What is somewhat troubling in the job market is that over the last three years the private sector has gained only 3,400 jobs while the public sector has gained 2,700 jobs. That means that over the last three years public sector job growth has accounted for 44% of all net job gains.
Wisconsin's private sector is made up of 8 industries. The top 5––Trade, Manufacturing, Professional Services, Leisure, and Other Services––account for about 67% of all private sector employment. Since March 2019, total employment in these industries has fallen by ~31,700.
Since March 2023, they've fallen by ~41,300.
Most of this is explained by losses in the Manufacturing sector, then Trade, and then Professional Services. About 1% job growth has occurred in Other Services, and Leisure & Hospitality (which tends to consist of part time work) has grown by about 3%.
The current labor market in Wisconsin since March 2023 is stagnant at best, and declining at worst. Government jobs have accounted for an inordinate share of total employment gains (44%), while inflation-adjusted wage data at the national level suggests stagnant or falling real wages. Real wage gains for the average worker seem unlikely.
In addition to the monetary and fiscal problems that have come about since the lockdowns, the United States' war on Iran has created instability in global energy and agricultural markets that the US economy cannot insulate itself from. The longer the war continues, the worse these markets will perform, and the stagnant US economy may very well transition into unambiguous decline.
Assuming the worst will come to pass, policy makers here in the state can mitigate the harm to Wisconsinites by implementing the tried and true method of keeping a balanced budget, cutting spending, and cutting taxes. Changes in monetary, foreign, and trade policy are unlikely to materialize, so local policymakers ought to direct their attention toward things they can change: local taxes, spending, and regulation.

Interested in the content of this Article?
Reach out to the MacIver Institute to aquire more information


