September 17, 2020
A MacIver Institute Analysis by Ola Lisowski
Hundreds of thousands of Wisconsin students went “back” to school last month, many of them from the comfort of their own homes. That means it is time for MacIver’s annual State of K-12 Education analysis for a year unlike any other.
We’d be remiss if we tried to discuss this school year without mentioning all of the changes that students, parents, administrators and teachers will be facing. When the pandemic first hit Wisconsin, many districts were not prepared to deliver instruction online and keep our children learning in such a different set up. Some parents in Milwaukee actually believe real instruction for students stopped after in-person, on-site school was closed.
Now, after six months of adapting, planning, and learning from the spring shutdown, a continuation of ineffective instruction and limited learning would be simply unacceptable. For the sake of Wisconsin’s kids and our future as a state, we hope districts have figured out how to ensure learning continues, no matter the format or set up.
Most of the biggest districts in the state are going to start the school year fully remote, including more than 74,000 students at Milwaukee Public Schools (MPS). MPS’ reopening plan calls for an online phase, followed by a hybrid model, and eventually a full in-person return once the district deems it to be safe. Transition between phases will depend on COVID-19 numbers.
Madison Metropolitan School District (MMSD) will have an all-virtual start at least until October 30, the end of the first quarter. Racine Unified is also following a quarter-by-quarter approach, and will operate virtually at least through November.
However, Kenosha School District, the third-largest district in the state, will begin by using a hybrid model. Families in all grade levels can choose whether to attend virtually or in-person. Other districts beginning the school year with at least some in-person instruction include Waukesha, Janesville, and Wauwatosa. The decision to physically open schools generally lies with school boards and their local health officials.
Regardless of what learning model a school district starts with, it is crucial that our schools get back to educating our children like they did before COVID-19. Our children cannot afford another disrupted, disjointed or ineffective school year. Neither can we as a state. Our future success or struggles depend on the academic achievement of our children.
Let’s take a look at where students were before the pandemic began. Much of the data here will be the last of its kind for some time, since most standardized tests were cancelled last spring. The state has already announced it won’t release new report cards this fall and some data that should have been released this summer was not released because of COVID-19. In each section, we’ll note whether or not the dataset has been updated, or whether the public is looking at slightly older numbers.
Academic Metrics
Graduation Rates
The graduation rate data presented here is among the last new school data we have. DPI released this particular set in early March, just before the shutdown began. However, no students were prevented from graduating last spring in light of the emergency, so the forthcoming 2020 figures will almost certainly be skewed.
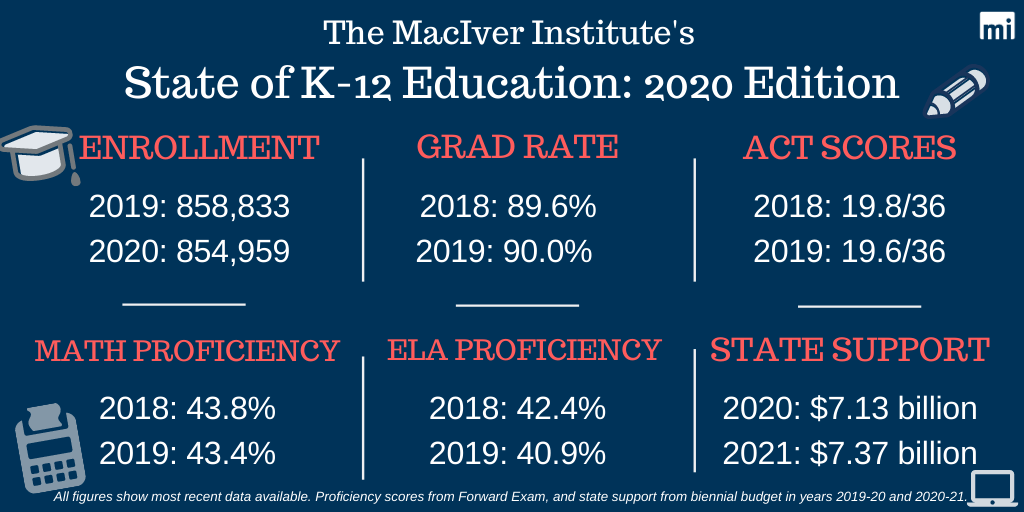
The four-year high school graduation rate has generally ticked up in recent years, and in 2019, 90 percent of students graduated on time. That percentage is up slightly from 89.6 percent in the prior year.
While the graduation gap between White and Black students decreased in 2019, it is still significant—the gap is 22.5 points between the two groups. In 2019, 93.8 percent of White students graduated in four years, while just 71.3 percent of Black students graduated in four years. Wisconsin has one of the widest graduation gaps in the country.
In 2011, the White-Black graduation gap was 27.6 points, meaning it has narrowed by just 5.1 points in eight years.
Hispanic/Latino students have shown the largest graduation rate improvement of any racial or ethnic group. In 2011, 72 percent of students finished high school in four years. In 2019, 82.8 percent of Hispanic/Latino students graduated on time, a 10.8-point improvement.
Forward Exam
Information in this section comes from the March 2019 administration of the Forward Exam, which is Wisconsin’s main standardized test for students in 3rd through 11th grade. Students normally take the exam in mid-late March. The 2020 exam was cancelled. Therefore, the following dataset will be the last new Forward Exam figures for quite some time.
According to DPI, students are graded as below basic, basic, proficient and advanced on the Forward Exam.
In 2019, only four out of ten K-12 students were proficient in math and English language arts, according to DPI data.
Statewide, just 40.9 percent of all students were proficient or better in English language arts, down from 42.4 percent in 2018. In math, only 43.4 percent of all students were proficient or better, a small decrease from 43.8 percent in 2018, the previous year.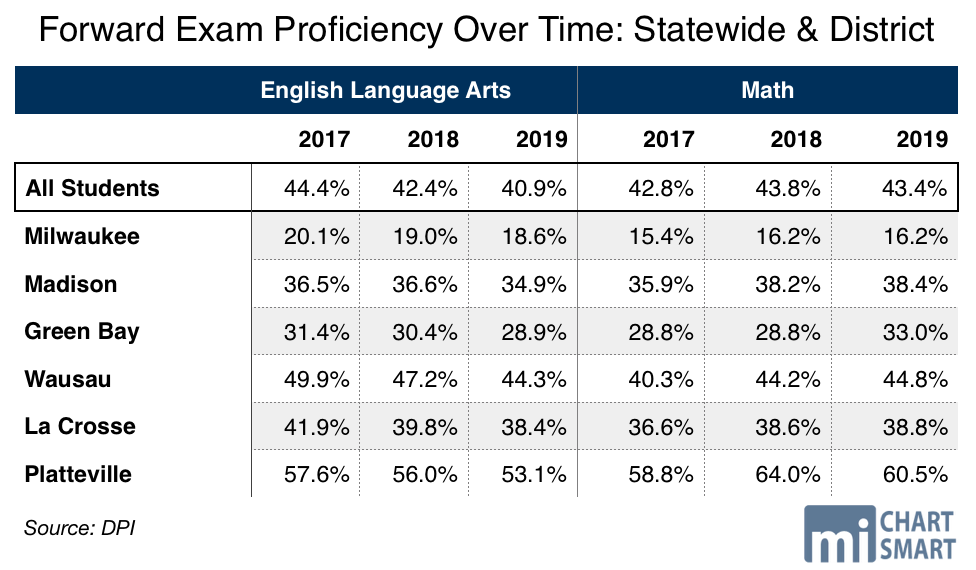
A student rated as “proficient” is performing at grade level.
More than one-third of students scored basic in English language arts, and 23.2 percent scored below basic. Plus, a larger portion of students received below basic scores compared to 2018, signaling a troubling achievement decline.
Significant achievement gaps exist between White and Black students on the Forward Exam. While 51.8 percent of White students were proficient or better in math, just 11.6 percent of Black students were proficient or better—a 40.2-point difference. In English language arts, 48.2 percent of White students were proficient or better, while 12.8 percent of Black students were proficient or better, a 35.4-point gap.
Students in every racial and ethnic group saw small proficiency declines in English language arts.
Students at MPS showed average proficiency far below the state average. Just 16.2 percent of MPS students are proficient or better in math, the same as in 2018. 18.6 percent of MPS students are proficient or better in English language arts, a small decline from 19.0 percent in 2018.
Math achievement gaps widened slightly at MPS. Just 9.4 percent of black students are proficient or better in math, a slight improvement from 9.1 percent in 2018. In 2019, 39.5 percent of white MPS students showed math proficiency, totaling a black-white achievement gap of 30.1 points, up from a 29.5-point gap in 2018.
MPS students fared a bit better at English language arts, with 45.3 percent of white MPS students proficient or better and 10.6 percent of black students proficient or better, for a 34.7-point gap. That’s slightly smaller than the 35.3-point gap in 2018.
With overall achievement among the lowest in the state, MPS typically receives much more attention for its low scores. But the data show Madison Metropolitan School District (MMSD) has an even bigger problem with achievement gaps.
In math, the Black-White achievement gap in Madison is a shocking 50.2 points. While most ethnic and racial groups slightly improved their math scores over the prior year, the achievement gap still increased by 0.2 points in 2019. For English language arts, the black-white achievement gap shrank by several points, from 49.2 to 47.2 points.
Overall, English language arts proficiency among all MMSD students fell from 36.6 percent to 34.9 percent. Students improved math scores by a hair, from 38.2 percent to 38.4 percent proficient.
Given that the 2020 Forward Exam was cancelled and effective instruction was disrupted for many kids, the next Forward Exam results are likely to show a decline in scores.
Advanced Placement (AP) Exams
Students across Wisconsin and the entire country take Advanced Placement (AP) Exams each May, hoping to receive college credit for their high school work. This past May, some Wisconsin students still took AP Exams, which operated remotely for the first time, with some COVID-19 changes. For example, tests were administered online and only included material that students would have learned by early March.
Even in a “normal” school year, AP Exam results are typically released the following year. The 2019 dataset below is the most current data and was released alongside Forward Exam results in early March of 2020.
Fewer high school students took AP Exams in 2019, in a small reversal of a trend that has otherwise shown great promise. In May 2019, 16.8 percent of high school students took an AP Exam, compared to 16.9 percent of students in the prior year. 66.3 percent of exams that students took in 2019 had scores of three or higher, which earn them college credits at all University of Wisconsin schools. In 2018, 66.5 percent of exams were scored three or better.
Overall, Wisconsin high schoolers took 1,300 fewer AP Exams in 2019 than in the year before, at 73,644 total exams. However, the figure is still a big improvement from 2011, when students took just 46,647 exams.
AP credits are an excellent way for students to get ahead on required college credits and save money on tuition. UW System schools are notoriously generous for AP credits, and scores of three or higher earn the test-taker at least three college credits on any exam.
Wisconsin students and families have saved considerable cash by taking these exams. If all of the 48,000 AP exams that Wisconsin students took in 2017 were converted to UW credit, it would result in a potential $32 million in savings for parents.
Remedial Education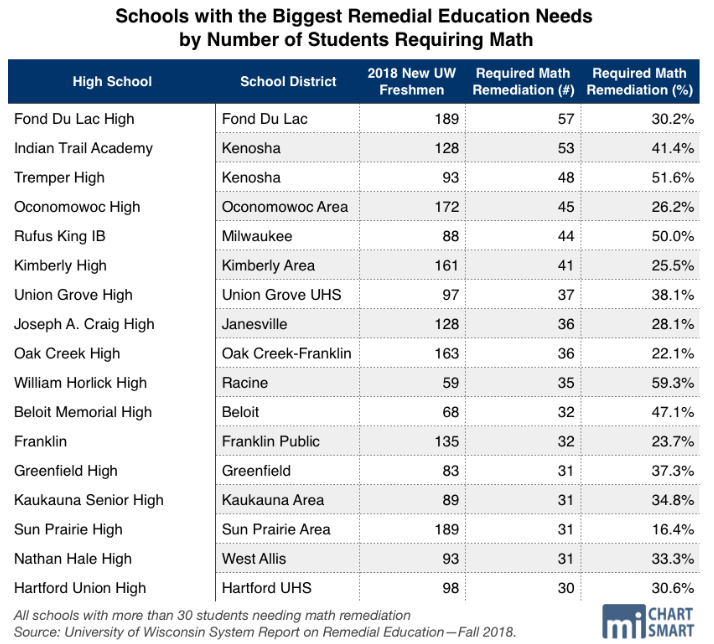
Information in the next section comes from a report published in late 2019, looking at students who entered the UW system in the fall of 2018. It is unclear whether a new report will come out later this year as normal.
While students with AP credits set themselves on a strong path to college completion, remedial students face the opposite problem. A 2019 report showed that students from 186 Wisconsin high schools were required to take remedial math or English when they entered the UW System as freshmen in the fall of 2018.
Students who take remedial classes at the UW pay full tuition for the courses, but receive zero college credit. The classes do not count toward degree completion and students must pass them before moving onto regular coursework.
Not surprisingly, students who take remedial classes in college are less likely to graduate, leaving them with thousands of dollars in debt—and no degree. If they do graduate, remedial classes lengthen the time spent in school, and increase college debt.
The UW System enrolled students from 16 schools where at least half of the students required remedial math in 2018, an uptick from 11 schools in 2017. Five of those schools are part of MPS. Milwaukee Collegiate Academy had the largest percentage of its graduating class needing math remediation, with 11 out of 12 students needing the classes.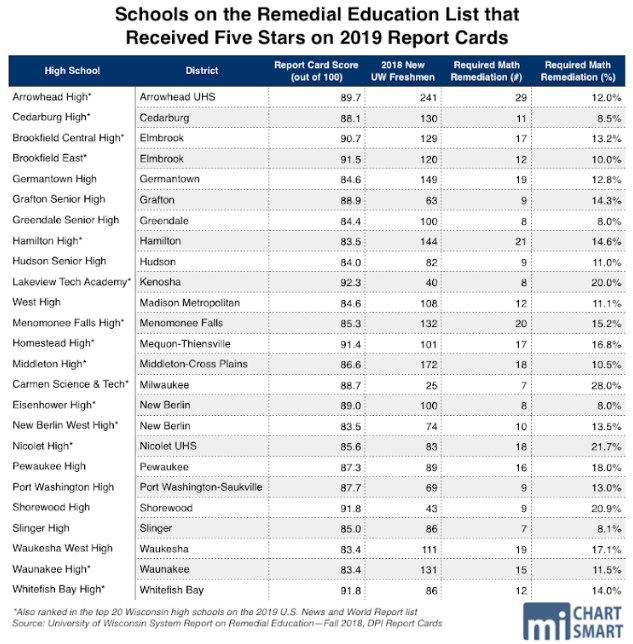
The data also show that a serious disconnect exists between state reporting and student achievement. On last year’s report cards, 44 high schools earned the highest marks possible (five stars). Of those, 25 schools appear on the latest remedial education report, showing that even students at well-ranked schools are not prepared for college. That’s a problem that increased over 2018, when 14 schools with five stars appeared on the remedial education list. We’ll discuss report cards next.
Report Cards
DPI’s annual school and district report cards are the biggest education data drop of the year. The state will skip this year’s release because of the pandemic and a lack of adequate data.
While report cards weigh many different metrics, the Forward Exam plays a big role in the calculations used to grade schools. As we noted earlier, the 2020 spring Forward Exam was cancelled.
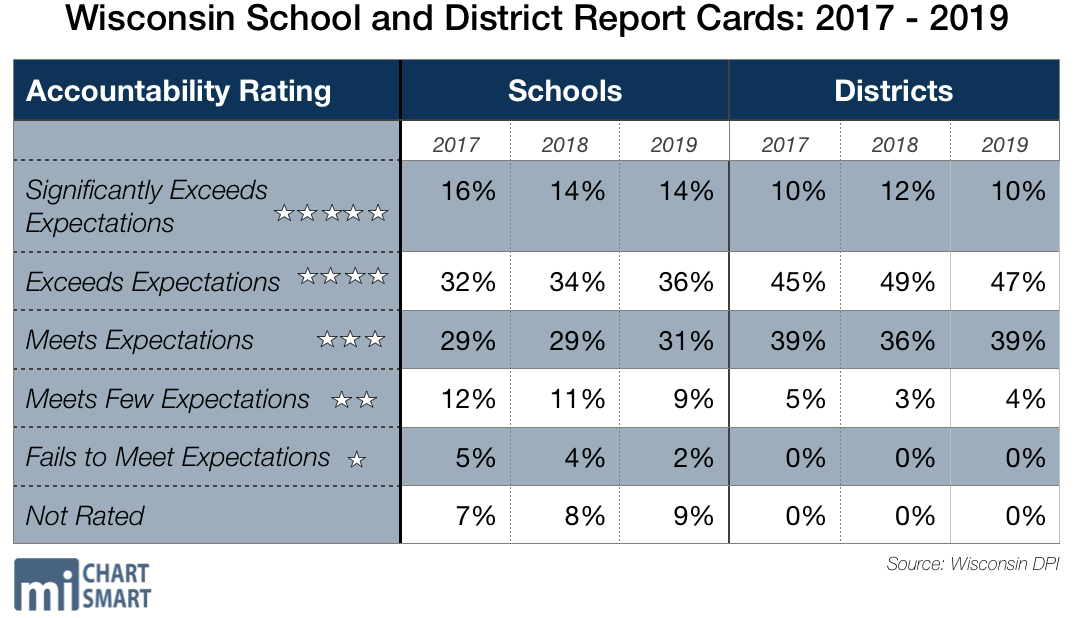
Last fall, the report cards showed that while schools are improving, district performance is trending downward.
The Mercer School District in Iron County was the only school district in 2019 to receive just one star, failing to meet expectations. That’s the first time the report cards dubbed a district with the failing score since 2017.
However, significantly fewer schools earned failing marks. Overall, 53 schools enrolling 27,635 students were ranked “failing” in 2019. In 2018, 95 schools enrolling 40,919 students received that ranking.
As we’ve noted in many past years, the fact that tens of thousands of Wisconsin students attend failing schools is simply unacceptable. Even while the official number fell significantly in the latest data, we know that a clear disconnect exists. For example, 44 high schools earned five stars on this round of report cards. Still, 25 of those schools appear on the latest remedial education report, showing that even graduates at high-ranked schools are not prepared for college.
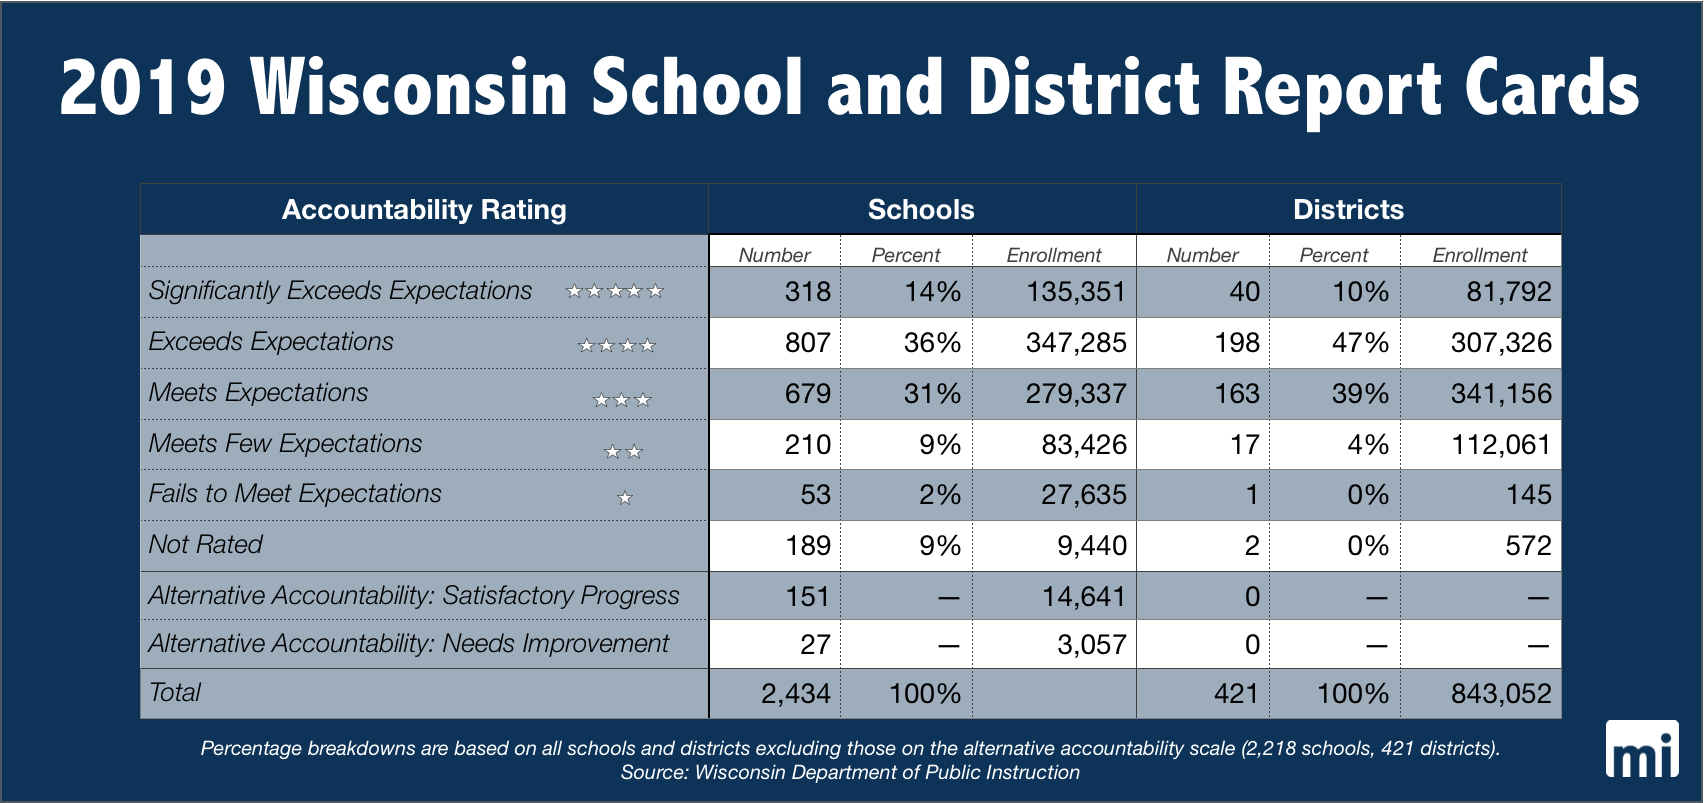
Most schools and districts are scored on a 0-100, five-star scale, from “fails to meet expectations” to “significantly exceeds expectations.” A small percentage of districts and schools use alternative accountability measures.
Districts and schools ranked with two stars “meet few expectations.” In 2019, 17 districts earned two stars, including Milwaukee Public Schools (MPS) and Racine Unified School District (RUSD). In 2018, 14 districts received two stars.
In 2019, 210 schools met few expectations, down from 249 in 2018.
Three-star districts and schools “meet expectations.” In 2019, 163 districts earned three stars, up from 152 in 2018.
For 2019, 679 schools earned three stars, more than 2018’s 671 three-star schools.
Four-star districts and schools “exceed expectations.” The majority of school districts, 198, fell into this category. In 2018, 206 districts earned four stars.
More schools fell into the four-star category than any other, with 807 schools exceeding expectations. That’s more than the 768 schools in 2018.
Finally, five-star districts and schools “significantly exceed expectations.” In all, 40 school districts earned top marks in 2019, down from 49 school districts in 2018.
A total of 318 schools earned five stars, down from 327 schools in 2018. However, more large schools fell into the category, as total enrollment in five-star schools increased from 123,073 to 135,351.
While Mercer School District received the lowest score in the state, with 50.4 out of 100 points, Arrowhead Union High School District received the top marks, with 89.7 out of 100 points. 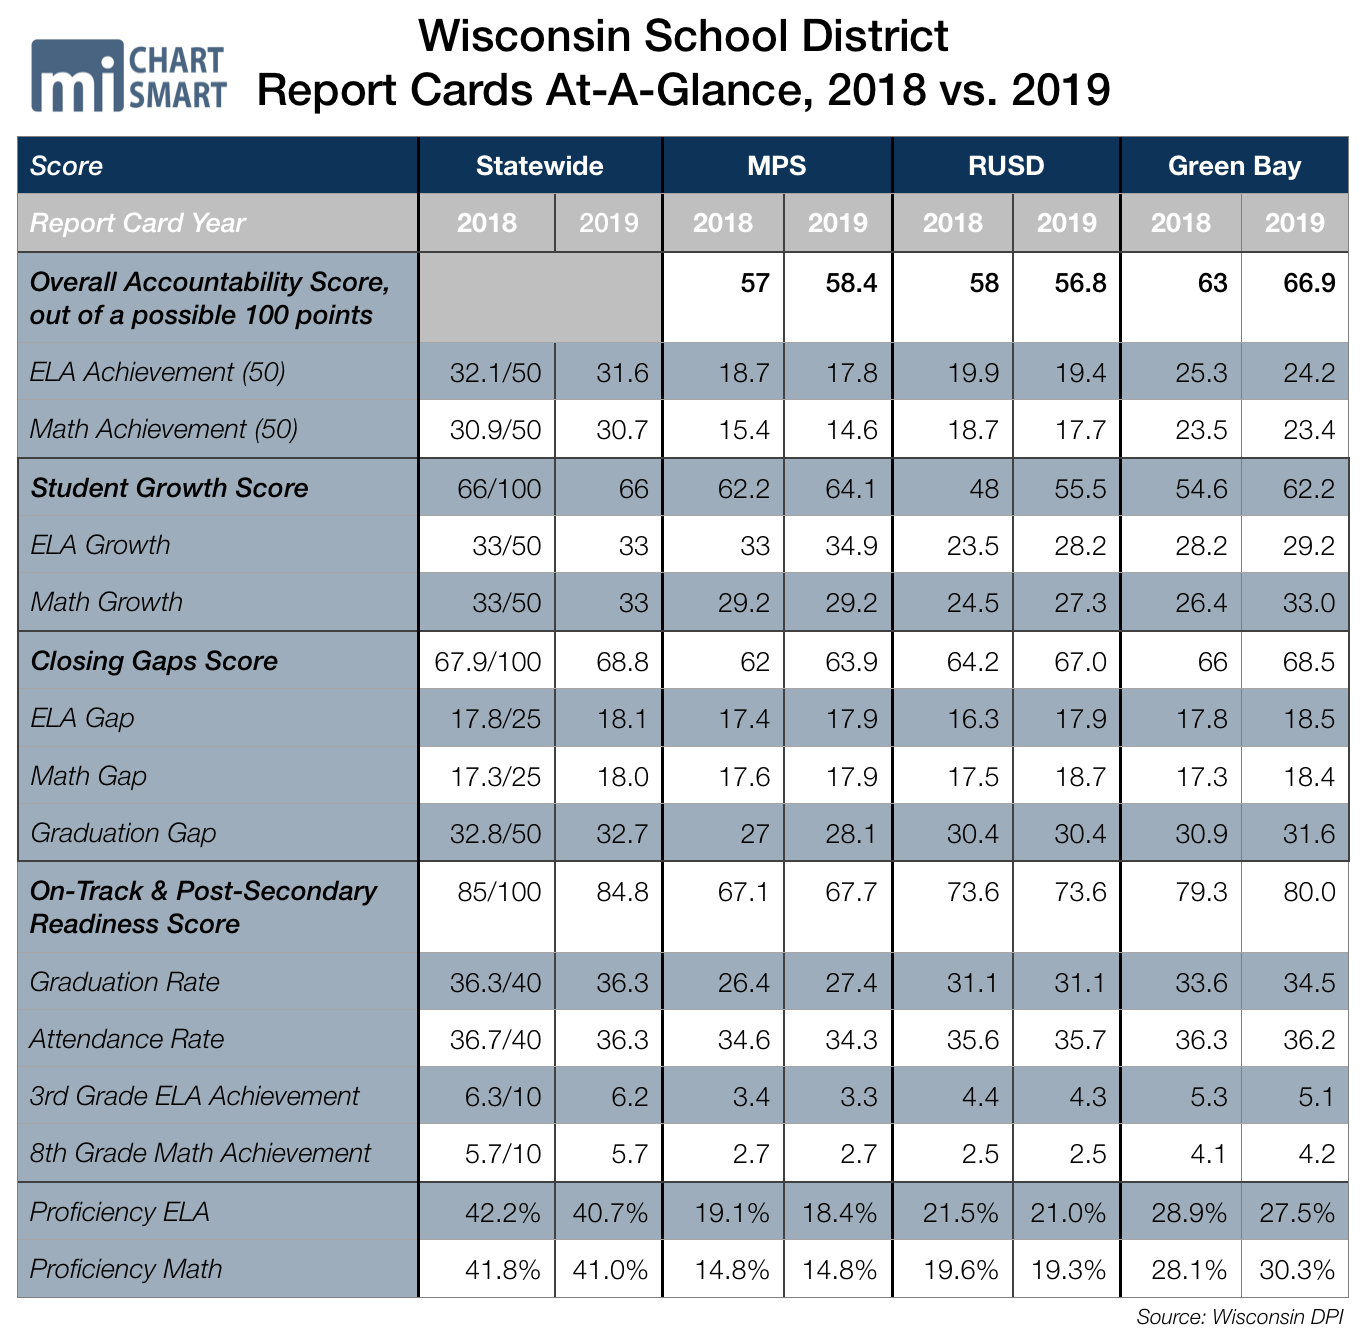
North Division High School at MPS received the worst score of any school, at 27.4 out of 100 points. Only 1.9 percent of North Division students are proficient in math, and 1.0 percent are proficient in English language arts.
In 2019, 20 percent of MPS schools received failing marks—less than the previous year’s 28 percent. In all, 28 Wisconsin schools enrolling 16,170 students were ranked “failing to meet expectations.” In 2018, 39 schools with a total enrollment of 22,446 students received the one star ranking.
That means the number of students enrolled in failing schools fell by almost 30 percent in one year. It also marks the second year in a row that fewer MPS students are attending failing schools. This is encouraging news.
Still, the 16,170 students stuck in a failing MPS school, on their own, nearly equal the entire population of Kaukauna. MPS has a long way to go to adequately prepare all of its students for life after high school.
Students in private school choice programs showed significant gains again, with school rankings moving up. While 11 schools earned one star in 2018, four schools earned that ranking in 2019. In 2018, 14 schools earned top marks, and in 2019, 23 received the highest five-star ranking.
The data also reflect the impressive growth in the school choice programs. Student enrollment increased by 8 percent in one year. A total of 322 schools received report cards in 2019, up from the prior year’s 281 schools.

Still, ratings on the five-star scale requires several years of data. For that reason, 58 percent of choice schools enrolling more than 5,500 students were not rated on the five-star scale.
In all, 32,536 students attend private choice schools that received report cards on the traditional ranking scale. Approximately 16 percent of those students attend schools that received just one or two stars this year. That marks a significant improvement from the prior two years. In 2018, 8,606 students attended schools with one or two stars, or 28 percent of student enrollment at ranked schools.
In 2017, 6,138 students attended 25 private choice schools with failing scores. In 2019, the number of failing schools has dwindled to four, enrolling 1,261 students. It’s a stunning decline in the number of one-star schools.
The same is true at the other end of the scale. In 2017, 12 private choice schools received five stars, and in 2018, 14 received five stars. In 2019, 23 private choice schools with total enrollment of 5,369 earned the top distinction.
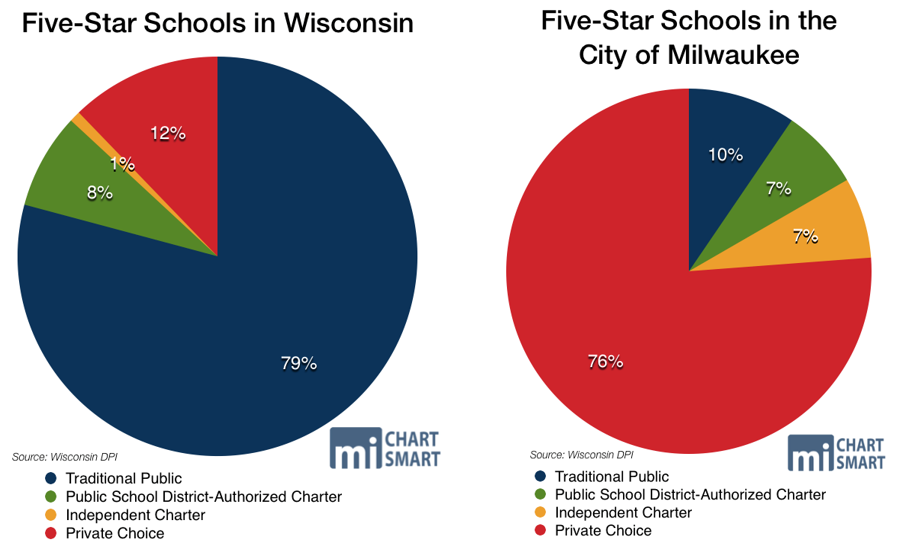
School data continue to show that Milwaukee’s private school choice program is achieving strong results. Students at these schools tend to outperform similar public school peers, and both participation and student enrollment in the program grow year after year. The report card data provide another look at why Milwaukee’s choice programs are in such high demand: out of the 42 five-star schools in the city of Milwaukee, 32 are private choice schools. It’s a stunning win for choice advocates, who have long defended their model.
The Best Schools In The State
When looking through the data to find the highest overall math and English language arts proficiency in the state, we found something remarkable: the same three schools hold the honor in both categories.
Odyssey Magellan in Appleton, Leonardo da Vinci School for Gifted Learners in Green Bay, and Accelerated Advanced Learning Program in Oshkosh have the highest math proficiency and the highest English language arts proficiency in the state. The state should look to their efforts for inspiration and replication.
At Odyssey Magellan, 96.7 percent of students are proficient in math and 94.7 percent are proficient in English language arts. Those results give the school the highest ELA proficiency rate in Wisconsin, and the second-highest math proficiency rate. The traditional public school received 98 out of 100 points overall, the second-highest score in the state. A total of 153 students in grades three through eight attend the school. Twelve percent are economically disadvantaged and 11 percent use open enrollment to attend.
Green Bay’s Leonardo da Vinci School has the highest level of math proficiency in the state, with 97.4 percent of students proficient in the subject. In English language arts, 94.5 percent of students are proficient, the second-highest rate in the state. Leonardo da Vinci School is a traditional public school enrolling 385 students in kindergarten through eighth grade. With 97 out of 100 possible points, the school received the fifth-highest accountability score in the state. One-third of all students use open enrollment, and 11 percent of students are economically disadvantaged.
At the Accelerated Advanced Learning Program in Oshkosh, 95 percent of students are proficient in math and 92 percent are proficient in English language arts. The proficiency rating is the third highest among all schools in the state for both subjects. AALP is a public charter school enrolling 60 students in grades four through eight. In all, 8.3 percent of students are economically disadvantaged.
ACT Exam
The most recent ACT Exam data was for the class of 2019, and was released in early March 2020. Most high school juniors were able to take the exam before schools shut down in the spring, but that data won’t come out until next year.
Students in the class of 2019 scored an average score of 19.6 out of 36 points on the ACT Exam, the most common college entrance exam in the region. That score was a slight decrease from the class of 2018, which earned an average score of 19.8 points.
In English, students scored an average of 18.4 out of 36 points, slightly lower than the prior year’s average of 18.8 points. Students fared a little better in math, with an average score of 19.4 points. That score was also a small decline from 2018, when students scored an average of 19.9 points on the math section.
The participation rate also decreased for the first time in several years, dipping from 92.8 percent to 91.9 percent. This marks the first time since the state began administering the ACT Exam for free to high school juniors that the rate fell compared to the prior year, and the first time the average score fell.
Non-Academic Metrics
2019-2021 State Budget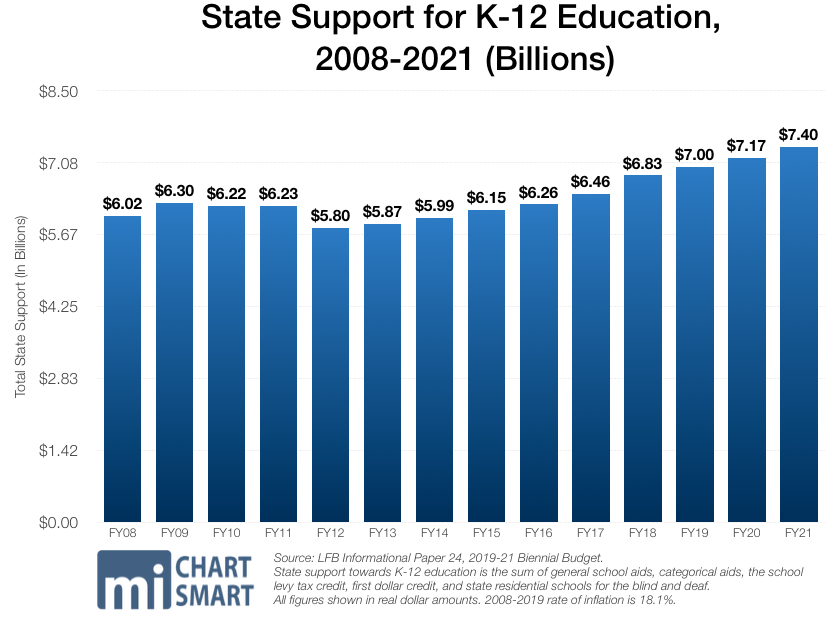
Schools are currently operating under the 2019-21 biennial state budget, which was Gov. Tony Evers’ first budget.
That document approved over $655 million in new spending for K-12 schools over the biennium, on top of years of recent increases. The 2017-19 budget, Gov. Scott Walker’s last, raised K-12 funding by over $630 million more.
After going through the legislative process, Evers’ final budget was quite different from his original proposal. His original plan would have raised K-12 spending by another $1.6 billion. The former State Superintendent would have frozen enrollment in the state’s school choice programs, and banned independent charter school authorizers from starting new charter schools until 2023. He also would have ended the Special Needs Scholarship Program, with no new students allowed to participate beginning in 2020-21. 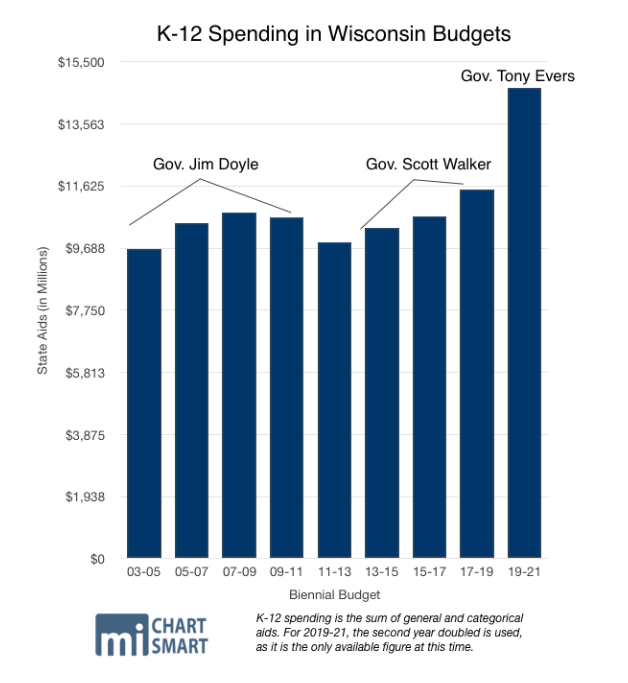
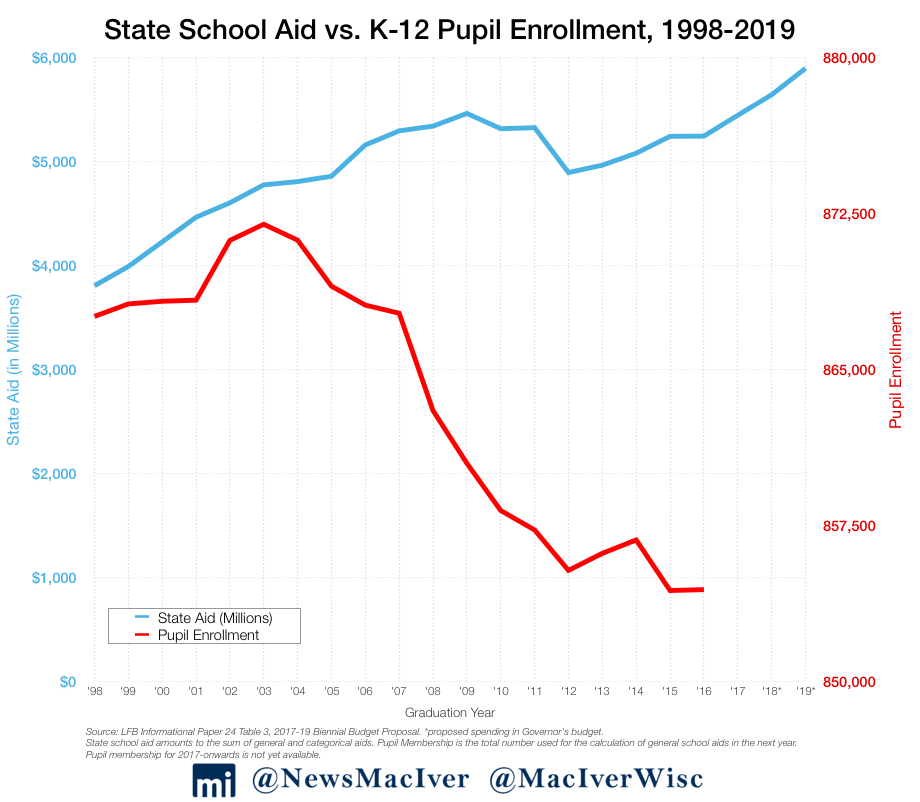
Despite often-heard rhetoric, the data show K-12 funding has increased for years, now topping $7.4 billion in the current fiscal year. Plus, public school enrollment has fallen for decades, which means the state continues to spend more money to educate fewer children.
Still, even while K-12 education funding has jumped dramatically in recent state budgets, just 53.6 percent of all spending goes toward classroom instruction. Despite record-high increases to education funding, the percentage of dollars reaching the classroom fell slightly compared to the prior year.
Those figures come from the 2017-18 school year, the most recent data available. In fiscal year 2018, districts spent an average of $13,505 per student, a $323 increase from 2017, when districts spent an average of $13,182 on each student.
However, instruction costs average $7,245 for each student, taking up just shy of 54 percent of all spending.
The data reflect funding during former Gov. Scott Walker’s final state budget, for the 2017-19 biennium. That budget increased K-12 spending by more than $630 million over prior levels. 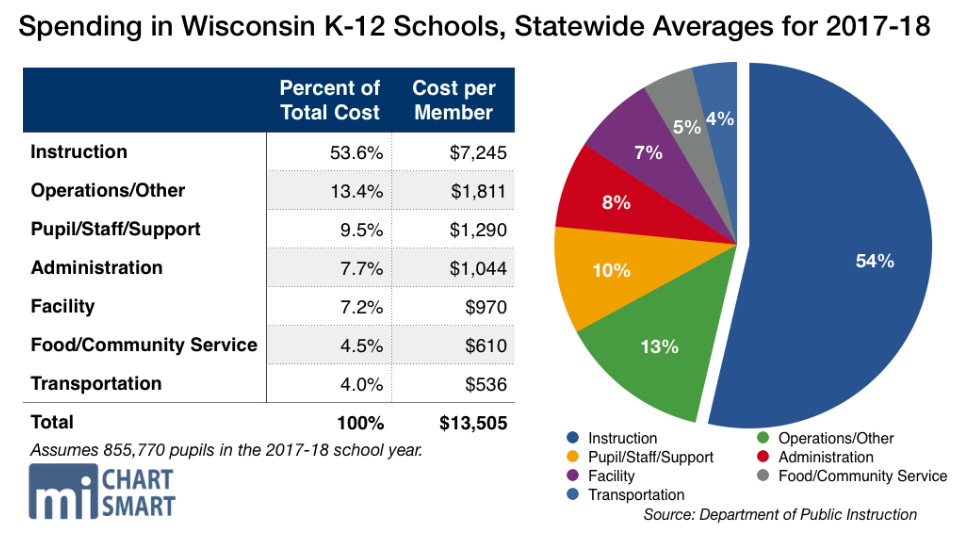
Enrollment
Overall student enrollment has continued to fall, with a 0.45 percent decline from the prior year. The third-Friday headcount in September 2019 showed that 854,959 children attend public K-12 schools. In 2018, the headcount was 858,833, and in 2017, it was 860,138.
While enrollment in public schools has fallen for years, school choice has never been more popular in Wisconsin. Tens of thousands of students attend choice schools across the state, including over 9,000 in the Wisconsin choice program, more than 28,000 in Milwaukee, over 3,500 in Racine, not to mention the nearly 61,000 students participating in public school open enrollment.
Early reports around the country have shown that homeschool and school choice enrollment have skyrocketed amid the pandemic.
We’ll watch those data reports closely here in Wisconsin to get a sense of what types of decisions families are making.
To that end, we’ll also be closely watching how districts and schools navigate the next school year. Make no mistake: this is a critical time for our students. In too many districts, learning was entirely disrupted last spring. While some districts did a better job at ensuring learning continued, others did not. All of us—kids, teachers, parents, and administrators—must do better this year.