While last year’s report card designated five school districts as “failing,” this year zero districts took home the one-star review but the number of failing schools increased
MacIver News Service | November 21, 2017
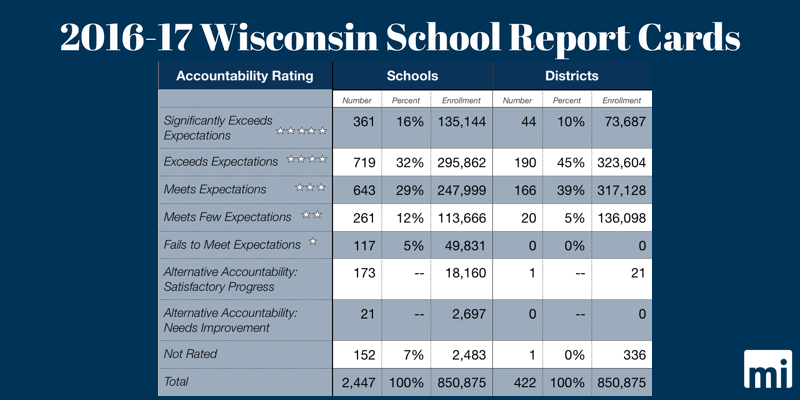
MADISON, Wis. – The state’s Department of Public Instruction has released school and district report cards for the 2016-17 academic year. Zero school districts received a failing grade, down from five districts last year. The number of failing schools rose from 99 to 117, an 18 percent increase.
While zero districts received failing grades, the 117 failing schools enroll 49,831 students – almost as big as the city of La Crosse.
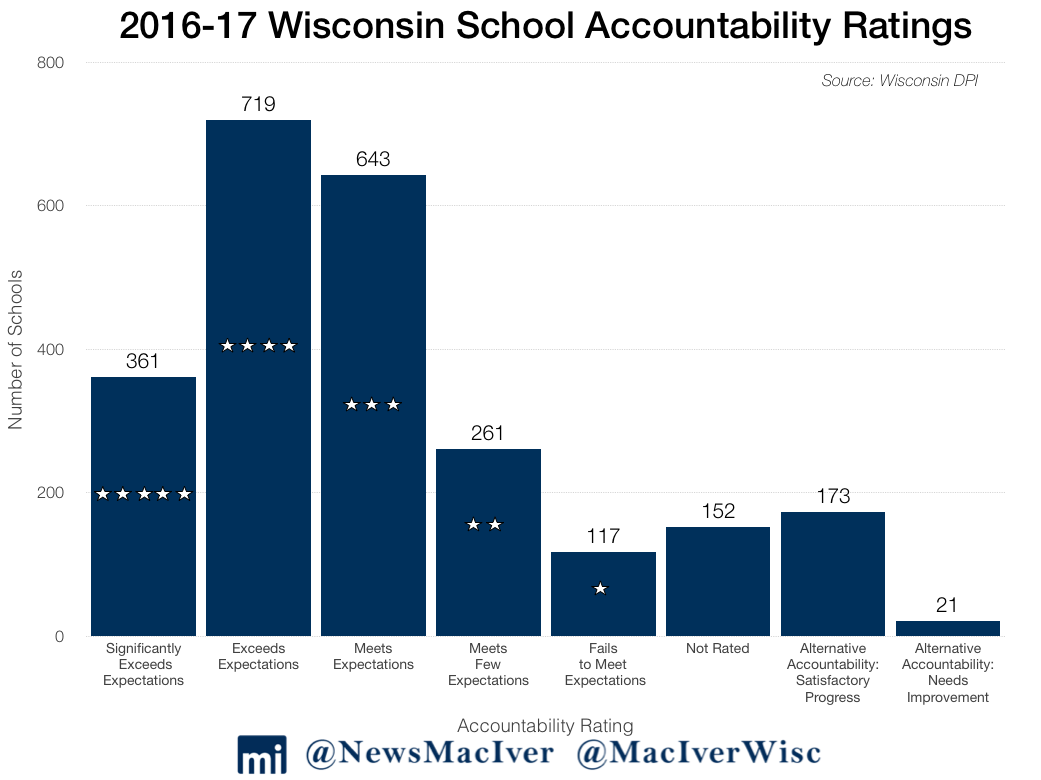
On the other side of the scale, 44 districts and 361 schools significantly exceeded expectations, the highest rating possible. This year, more individual schools but fewer districts received the top mark. 32 more schools, but 10 fewer districts, received five out of five stars.
2,114 public schools and 251 private choice schools received report cards. 77 percent of Wisconsin schools received three of five stars or more, signifying that they significantly exceeded expectations, exceeded expectations, or met expectations. 94 percent of districts fared the same. The majority of districts that received report cards were graded on a five-star scale, from “fails to meet expectations,” or one star, to “significantly exceeds expectations,” or five stars.
Most Wisconsin students continue to underperform. The number of failing schools is up, even though the number of failing districts is down to zero. The statewide achievement score is just 66 out of a possible 100 points, with Milwaukee Public Schools (MPS) achieving the lowest district score at 56 points. No district is officially declared to be failing, but almost 50,000 students attend failing schools – bigger than the city of Sheboygan and just under the size of La Crosse.
A deeper dive suggests that official markers of success may not reflect reality. The 117 failing schools enroll 49,831 students. Within MPS, the state’s biggest district, four schools out of 138 received the highest rating of significantly exceeding expectations. Over 1,550 students attend those schools. On the other side of the spectrum, just under 25,000 students attend the 45 schools in MPS which received failing grades.
A subsequent MNS story will explore the scores of MPS and other districts in grea ter depth.
State Superintendent Tony Evers, who is running for Governor, did not include a statement in the department’s official press release.
The majority of schools that received report cards were scored on a five-star, 100-point scale ranging from “significantly exceeds expectations” to “fails to meet expectations.” Overall scores are calculated based on several priority areas for students: achievement, growth, closing gaps, and post-secondary readiness. The report cards mainly track English language arts (ELA) and mathematics progress, but also examine other variables such as attendance and test participation.
 The data release is the first in several years wherein the public can directly compare report cards with the prior year. It is also the first major state report card release that examines the achievement of school choice students.
Public school students took three different standardized exams in the three years before the state finally settled on the Forward Exam during the 2015-16 school year. Now that students have taken the same exam multiple years in a row, the public can accurately compare student achievement year over year.
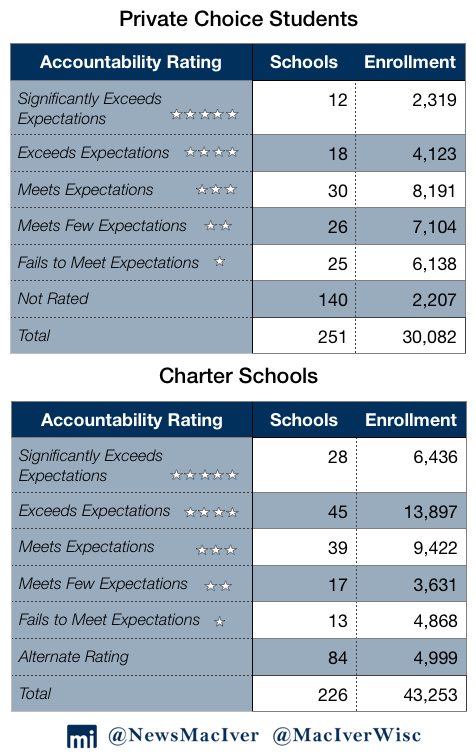
More than half of the choice schools that received report cards did not get a rating on the five-star scale. Schools must have two consecutive years of data in order to produce an accountability rating, as well as 20 students in each class for the entire academic year. Of the 111 schools that did receive ratings, 60 schools enrolling 14,633 students received three or more stars. 25 private schools enrolling 6,138 choice students got the lowest one-star rating.
More than 200 charter schools received report cards, posting impressive results. Of the schools that were rated on the five-star scale, nearly 80 percent received three stars or more. Almost 30,000 students attend those schools. On the other side of the scale, 13 charter schools enrolling 4,868 students received failing scores. Of the 84 charter schools that were scored on the alternate rating, just 7 needed improvement.
Just shy of 200 schools statewide, or about 8 percent of schools, were scored on an alternative accountability scale.
Four MPS schools enrolling about 1,550 students received a five-star rating. One-star ratings were much more common among the 138 scored MPS schools – 46 schools enrolling about 25,000 students received the lowest score possible.
Rather than being graded on a five-star scale, those schools were either designated as having satisfactory progress or needing improvement, with 11 percent falling into the latter category.
Under federal law, states must allow schools and districts to pursue alternative accountability ratings. Schools often use the alternative rating if they do not have normal tested grades, have fewer than 20 students in a class attend the entire academic year, serve exclusively at-risk students, or if they are a new school.
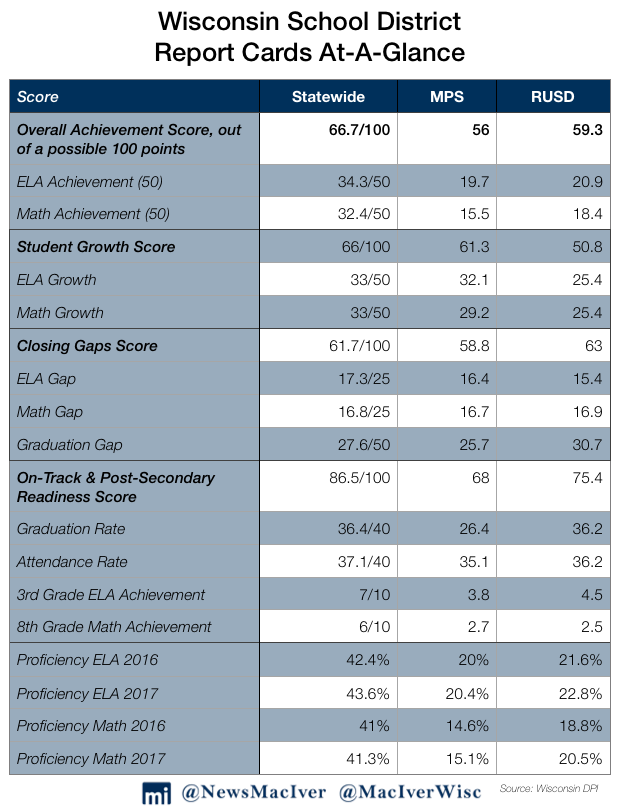
The data release was not without asterisks. Last year, state officials changed the criteria by which districts and schools would be scored. If a district has higher levels of poverty, the overall growth of student achievement is more heavily weighted than overall proficiency. For example, a high-poverty district such as MPS receives a weight of 90 percent for growth and just 10 percent for achievement.
In a call with media, DPI officials explained that “growth” scores are normative – all schools and districts are considered in comparison to all other schools and districts. As a result, it is possible for a school to have the same amount of growth last year and the year before while having lower growth score. In the eyes of the report card, what matters is how the school or district compared to others. As a result, some districts saw their schools’ score grow by over a dozen points despite not having significant changes in student achievement.
MacIver News Service will continue to update this story with reactions as they are made available.