November 24, 2021
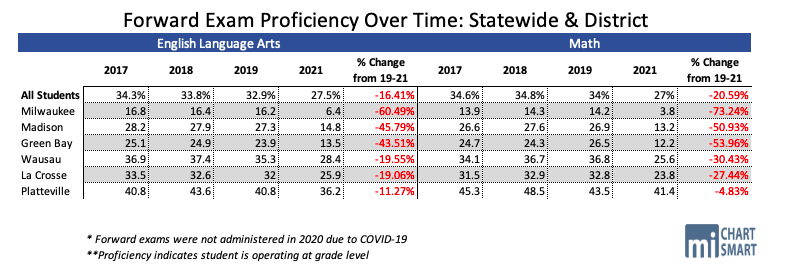
The MacIver Institute recently published an article sharing the irony that so many of Wisconsin schools and school districts “met, exceeded, or significantly exceeded expectations,” according to the Department of Public Instruction, while only 27% of students are proficient in ELA and 27.5% are proficient in math. In other words, somehow most of our students are failing this important benchmark, yet the state believes the vast majority of schools and districts are doing a good job.
Here we take a deeper dive into the report cards and the data used to arrive at these curious and suspect grades from the Department of Public Instruction.
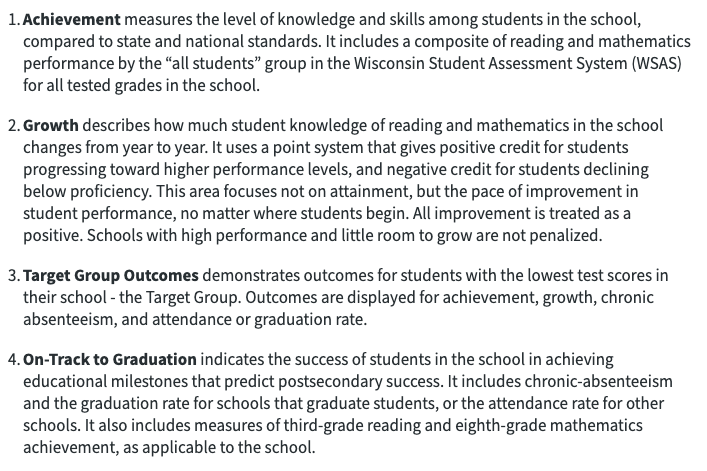
According to DPI, their report cards are calculated based on a formula taking into account the following metrics: achievement, growth, target group outcomes, and on-track to graduation. These report cards are given to public schools, choice schools, and school districts. See the screenshot below for how DPI defines each of these categories.
Each area is weighted differently by district and school (for example, some schools place a heavier emphasis on growth or achievement). It is unclear how DPI determines the weight assigned to different districts for their scores.
According to DPI, “The Closing Gaps priority area of the report card has been replaced by the Target Group Outcomes priority area to make the measure more reliable, inclusive, and actionable for schools and districts. Target Group Outcomes focuses students in roughly the bottom quartile (25%) of performance based on the prior year’s test results. This priority area is scored using a multiple measure system from other priority areas – achievement, value-added growth, chronic absenteeism, and attendance or graduation rates.” This change was apparently made without the opportunity for public or legislative input.
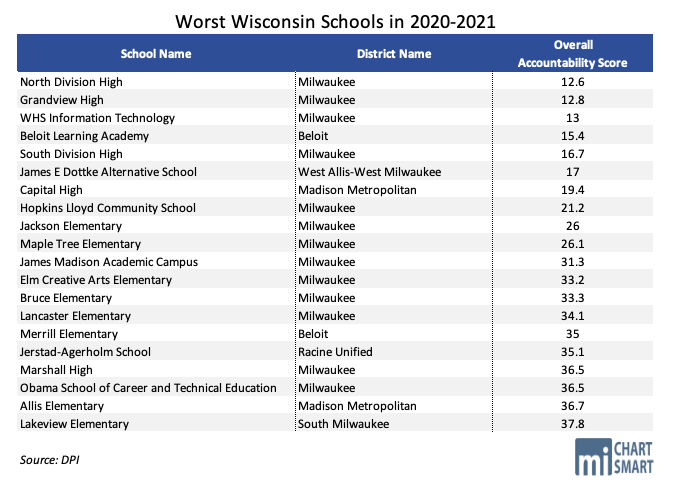
Worst Schools in Wisconsin
All twenty of the districts receiving the lowest scores in the 2020-2021 report cards received a “fails to meet expectations” mark. A total of 73 Wisconsin schools and two Wisconsin school districts failed to meet expectations. 13 out of the 20 lowest-scoring schools are in the Milwaukee Public School District.
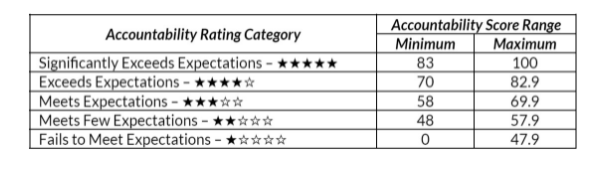
As the MacIver Institute pointed out in our original article on the district report cards, the grading scale used to evaluate districts and schools is unusually lax. It should also be noted that without any public notice or comment, DPI changed the grading scale this year and made the curve easier for a school to receive a passing grade. In the last report card, in order for a school district or school to qualify as having “Exceeds Expectations”, a minimum score of 73 was required. Now, the minimum score to reach exceeding expectations is 70, a full three points lower. The minimum score to reach the supposed satisfactory level, in traditional grading terms the “C” level, was reduced from 63 to 58.
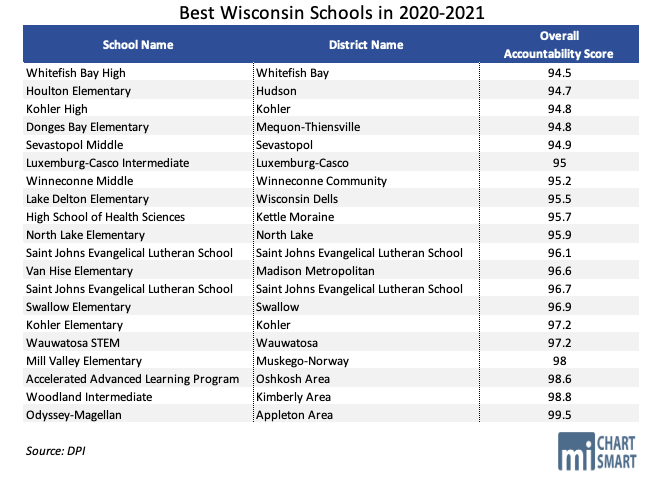
Best Schools in Wisconsin
Conversely, all of Wisconsin’s top twenty scoring schools scored as exceeding expectations. A total of 324 schools and 39 Wisconsin school districts exceeded expectations in the 2020-2021 reporting period. Among the twenty best schools in the state, there appears to be no strong trend as it relates to district or location in the state.
All of this data is publicly available on DPI’s website.
School Districts
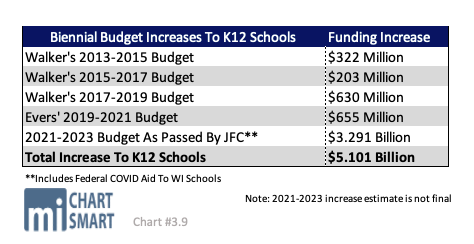
It is important to remember how much money went to Wisconsin schools this year through the state budget and federal COVID aid. Over the past year, schools have received historic levels of funding — roughly $3.291 billion. Yet, in spite of this, we still are seeing dismal results for our children.
Let’s take a look at how the state’s largest districts were graded.
Milwaukee Public Schools
Milwaukee Public Schools received a score of 58.1, which equates to meeting expectations on the report card for the 2020-2021 school year. This is down slightly from 2018-2019 when the district received 58.4. As a reminder proficiency scores for MPS were 6.4% in ELA and 3.8% in math for the 2020-2021 school year. Additionally, MPS has 13 of the 20 worst schools in the state. How can the district receive a score of 58 — meeting expectations — when it is home to 13 of the worst schools in Wisconsin?
Madison Metropolitan School District
In the 2020-2021 school report cards, Madison Metropolitan School District received 70.2, exceeding expectations. This is down from 2018-2019 when the district received 72.3. Proficiency scores were also down from prior years in MMSD, with 14.8% of students proficient in ELA and 13.2% proficient in math. Again, how can a school district, in which less than 15% of students are proficient in math or English exceed expectations according to DPI?
Green Bay Area Public School District
Green Bay Schools received 59.5 on their 2020-2021 school report card, meeting expectations. This is down seven points from 2018-2019 when the district received 66.9. In 2020-2021, student proficiency scores were also down at 13.5% of students proficient in ELA and 12.2% proficient in math.
Wausau
Wausau schools received 68 on their report card, meeting expectations in 2020-2021. This is down from 2018-2019 when the district received 73.6. Similar to other districts, proficiency scores in Wausau were also down in 2020-2021, with 28.4% of students proficient in ELA and 25.6% proficient in math.
La Crosse
In the 2020-2021 school year, La Crosse schools received 63.6, meeting expectations. This is down seven points from 2018-2019 when the district received 70.9. Proficiency scores were also down in the district with 25.9% of students proficient in ELA and 23.8% proficient in math.
Platteville
Platteville schools received 71.2 on their 2020-2021 district report card, exceeding expectations. This is down from 2018-2019 when the district received 76.8. In 2020-2021, Platteville’s proficiency scores were down slightly (although the drop was not as drastic as in other districts), with 36.2% proficient in ELA and 41.4% proficient in math.
The MacIver Institute will continue to analyze the report card data and update our findings, so be sure to follow our website and social media for the latest.