DHS’ COVID-19 Activity Level metrics mark 88.9% of counties with “high” virus activity, despite counties with few cases and few or no new deaths, hospitalizations
Flat case growth equals high virus activity, per DHS
September 4, 2020
With the endless stream of negative news on the coronavirus in Wisconsin, it’s easy to forget how well our state has actually been faring against the pandemic.
After six months and over 1.26 million tests, only 1.3 percent of the state’s population has tested positive for COVID-19. There have been 1.18 million tests that have come back negative so far. For most people who’ve tested positive, COVID-19 proved to be an illness they were able to treat at home.
Those who couldn’t be treated at home have never come close to overwhelming our hospitals. For the past month, hospitalizations throughout the state have ranged between 250 and 390 patients admitted at any given time. Daily hospital counts reached a peak on May 29 with 423 hospitalizations. That was over three months ago.
As of September 1, 1,130 people have died of the coronavirus in Wisconsin. However, most of those individuals who have died also had other serious health conditions at the time of their death. Less than 3 percent of Milwaukee County’s COVID-19 fatalities, 1 percent statewide, died exclusively from COVID-19. That means for the average, healthy person of most any age, recovering from COVID-19 is likely.
Despite all these successes, DHS and the Evers Administration are still bent on highlighting all the negatives of COVID-19 through more suspect modeling and deceiving data points.
First they published a bad model that predicted 1,500 Wisconsinites would be dead by April 8 without a statewide shelter-in-place shutdown. Then the administration used another bad model to predict up to 2,400 people could be dead in Wisconsin by May 1, regardless of Safer at Home being in place. The Evers Administration for months talked about a “surge” of patients overwhelming Wisconsin’s hospital systems without highly restrictive policies to “flatten the curve.”
The Evers Administration shifted its focus once the State Supreme Court shut down the second state Safer at Home lockdown in May. Now the Administration’s and DHS’ questionable modeling is attempting to spook the public with their COVID-19 Activity Level by Region and County data.
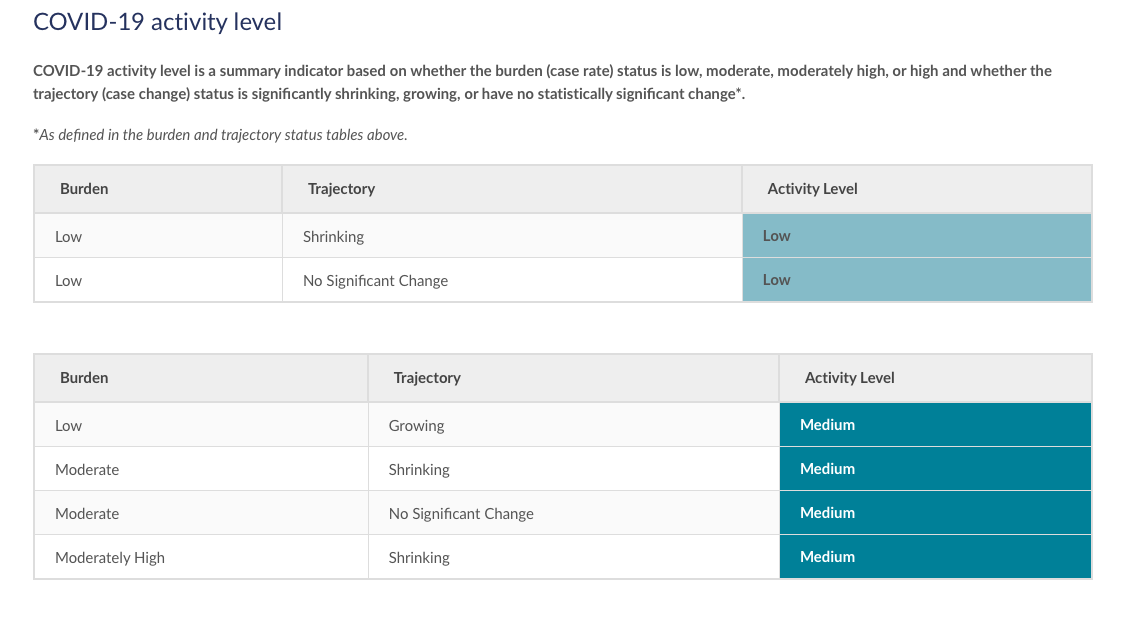
The Activity Level dataset is updated every Wednesday and focuses on new cases over the previous two-weeks. The activity level of each county is based on two metrics: trajectory and burden of new cases of COVID-19. The two metrics are used by DHS to rank counties from low to medium to high activity levels of COVID-19.
According to the September 2 update of the activity level data, 64 counties, or 88.9 percent, were reported to have a “high” activity level, 8 counties had a “medium” activity level, and zero counties had a “low” activity level.
The dataset is, by DHS’ admission, meant for public awareness and policy-making. “This information can help inform individual residents and local leaders of business and other institutions as they take steps and precautions to reduce the spread of COVID-19,” the Activity Level page reads.
The data has already been used by local public health officials to make far reaching decisions. Public Health Madison and Dane County said in its August 10 weekly data notes that it will use this activity level to “determine when we may need to “rebound,” i.e., tighten restrictions or move backwards to a previous phase” in their county reopening plan.
Washington Ozaukee Public Health Department uses the activity levels to recommend the capacity of people that private businesses allow into their establishments. Winnebago County Public Health Department includes the county’s activity level in almost all of its daily situation updates.
In reality, the COVID-19 Activity Level dataset doesn’t tell the public enough to understand the spread and severity of the virus. Yet local public health departments are relying on this snapshot to make decisions affecting the lives and livelihoods of their residents. So what does the COVID-19 Activity Level metric measure, what does it mean, and what does it leave out?
Trajectory
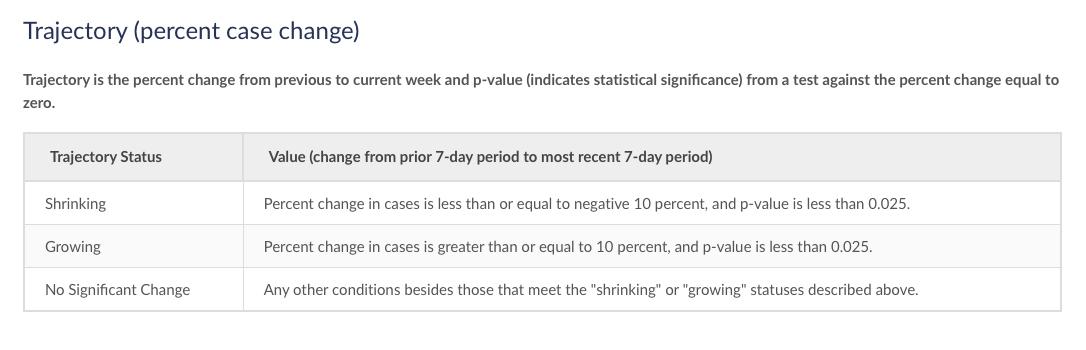
One of the two key metrics DHS uses to determine COVID-19 activity is trajectory. The trajectory examines the growth of new cases in each county over a two-week period. If cases in the second week increased over the first week, then DHS says the trajectory is growing. If new cases in the second week decreased from the first week, then the trajectory is shrinking.
The biggest problem with this metric is that most of Wisconsin’s counties don’t have an upward trajectory, yet still supposedly have a “high” COVID-19 activity level. Between August 20 and September 2, DHS reports 51 out of Wisconsin’s 72 counties, 70.8 percent, have “no significant change” in activity week-over-week.
Yet, 43 of those counties with no trajectory were still recorded with “high” activity levels. Eight counties have shrinking trajectories, and all eight are given “high” activity levels.
Trajectory is one of the only two metrics that determine virus activity, but even with one metric showing flat or decreased movement of the coronavirus, the majority of counties are being labeled with a high activity level. How can that be possible?
When DHS labels counties with “high” activity levels, it signals to local government leaders, businesses and other institutions that they need to ramp up precautions as if there were a crisis. For 51 counties, however, to see “no significant change” or a decrease in their COVID-19 trajectories indicates there’s not actually a crisis-level, “high activity” spread.
Burden
DHS’ case burden metric measures new cases in a two-week period per 100,000 people. If a county has a population of 100,000 people and 1 person tested positive for COVID-19 over a two-week period, that means the burden is 1. If 50 people tested positive in that same county, the burden would be 50.
A “low” rate is less than 10. “Medium” is between 10 and 50. “High” is anything over 50.
Between August 20 and September 2, Iron County had the highest burden in Wisconsin with 580 cases per 100,000 residents. However, Iron County only has a population of 5,916 people, so there were actually 34 people in the county who tested positive for the coronavirus during those two weeks. That’s just over 2 new cases per day. That’s all it takes for Iron County to get marked with a “high” activity rate.
During the same time period, Rusk County had a burden of 21 new cases per 100,000 people. However, Rusk County’s population is only about 15,000, which meant only 3 new cases had been reported over the course of two weeks. DHS calls that a “moderate” burden. This combined with its flat trajectory earned the county a “medium” activity level by DHS.
For comparison, Milwaukee County had a case burden of 180 this week, with 1,707 new cases over the past two weeks. That’s about 122 new cases per day between August 20 and September 2. Milwaukee County is also given a “high” activity level.
This reveals another issue with the Activity Level metrics: Rusk County is only reporting 3 new cases in two weeks, yet the county still has a “medium” activity level. Iron County is reporting about 2 new cases a day, 34 new cases in two weeks, yet it’s given the same “high” activity level as Milwaukee County, which had an average 122 new cases per day. It would be nonsense to compare Iron County and Milwaukee County under any normal circumstance.
The burden metric also does not account for how sparsely populated a county is, something that will have a direct impact on how quickly the virus could spread and how likely it is that someone will have direct contact with an infected person. In more sparsely populated places like Iron County, a person is generally less likely to pass by other people, so then a person is also less likely to pass by someone who is infected with the virus. Conversely, in more densely populated places like Milwaukee County, a person is far more likely to pass a large amount of other people, which increases a person’s chances of interacting with someone who is infected with COVID-19.
Local Government Officials in both Iron and Milwaukee Counties, however, are led to believe that a high activity level means they need to maintain or increase restrictions on activity and commerce. How much sense does it make to tell Iron County restaurants that they can only operate at 50% capacity though, same as in the city of Milwaukee? How much sense does it make to tell Rusk County, with 3 new cases over the course of 2 weeks, that they should loosen their restrictions only a little bit less than Milwaukee County should? It doesn’t make sense, because this is an entirely flawed way to measure how dangerous a virus actually is.
The Other Problem With The Activity Level Ranking – What’s Missing
The COVID-19 Activity Level dataset relies solely on the previous two metrics to assess the virus’ severity, while ignoring all other metrics. Both of these metrics are based on new case counts. One metric, trajectories, gives incomplete information. The other, burden, makes the spread of the virus seem worse in places like Iron County than in Milwaukee County.
Neither of the two metrics account for asymptomatic infection, the severity of symptoms, how many infected people are hospitalized, or virus-related deaths.
MacIver looked at DHS’ activity levels measured from August 20 to September 2 in 10 counties–Brown, Dane, Eau Claire, La Crosse, Marathon, Racine, Rock, Vilas, Washington, and Waukesha County. In our chart below, we added the data that we felt was missing from a more accurate assessment of virus severity.
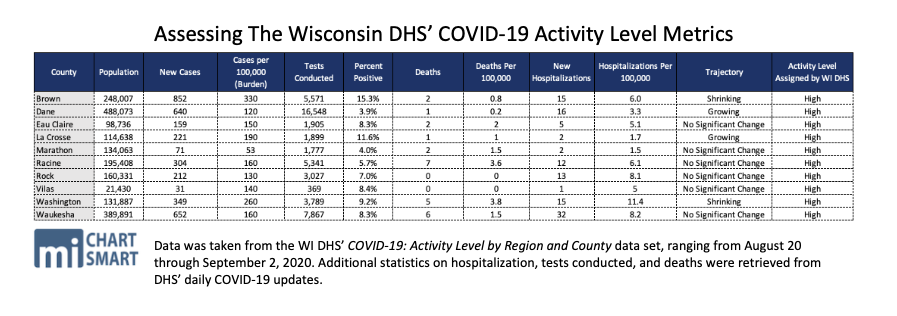
All 10 counties we observed were labeled with high activity levels. First and foremost, 6 out of the 10 counties were labeled high activity even though they had “no significant change” in their trajectories.
In two of the 10 counties–Rock and Vilas County–there were zero new deaths within the two-week data period. In five other counties–Brown, Dane, Eau Claire, La Crosse, and Marathon Counties–DHS recorded between 1 and 2 COVID-19 deaths during the same two-week period.
In Eau Claire, La Crosse, Marathon, and Vilas County, there were less than 10 new COVID-19 hospitalizations in two weeks. In Waukesha County, 6 new deaths and 32 new hospitalizations, in a county of 390,000 people, were recorded over two weeks. That’s about 3 new deaths per week and less than 3 new hospitalizations per day throughout the whole county.
In each of the counties listed in the table, it’s clear that neither deaths nor hospitalizations are rising to an unmanageable level.
Let us be absolutely clear: we believe all life is precious and the loss of life cannot and should not be minimized. Thank God, Wisconsin has experienced far fewer deaths and hospitalizations than any of the hot spots throughout America.
Yes, there are plenty of new cases statewide, but those new cases clearly are not all leading to hospitalizations or death. We are seeing the predictable growth of a virus, but not the growth of a crisis.
In their over-simplified expression of Wisconsin’s COVID-19 data, this is what DHS misses with its activity levels metrics. It’s leaving out half of the story. Yet DHS officials and county health departments like Dane County’s are using it to keep the economy locked down and prevent people from returning their lives back to some sense of normal.
“It’s very clear that Wisconsin continues to be at a high disease activity level,” said DHS Deputy Secretary Julie Willems Van Dijk to the press on August 7. “I would say we’re still at quite a high level and would encourage people to be very vigilant.”
They also see activity level as more important than how many people have recovered from COVID-19, according to DHS acting director of the Bureau of Communicable Diseases, Traci DeSalvo. “It’s actually more important to look at the cases over time and we want to epidemiologically look at what the new cases are, what the trajectory of our new cases is,” she said to the press at a DHS media briefing on August 13. “We think that really is telling the story of COVID-19 in Wisconsin and where we’re going a lot more than that “recovered” number.”
Recoveries reflect how dangerous the virus really is. If more people are dying than recovering, then the growth of new cases would be grave. But this is not the case. Disregarding how many people recover from the virus is, again, only telling half of the story of the spread.
So then what do new cases, trajectories, and burdens tell us about the virus? The movement of new cases. Nothing more. It doesn’t say how many people are being hospitalized or are dying from the virus, and it doesn’t express the rate of survival. Datasets like DHS’ Activity Levels’, then, do not accurately tell us how dangerous the coronavirus is.
What DHS’ Activity Level system actually does tell us about the virus is limited. This simplistic snapshot of COVID-19 in a county should not be the sole determinant or final word on lifting or tightening restrictions. Local officials and Wisconsinites deserve a better system and more complete data from the Evers Administration if the system is going to be used to make vital decisions about our livelihoods and our freedom.