DHS Says Focus on Weekly Averages, Even Though Daily Updates Drive Evers Administration’s Public Health Decisions.
September 15, 2020
Earlier this month DHS admitted to a massive data-management mistake that resulted in the permanent skewing of Wisconsin’s COVID-19 daily trend statistics.
On Friday, September 4th, DHS reported a jaw-dropping 1,498 new cases of COVID-19 in the state. That was double the number from the day before, and 30 percent higher than the previous single day record set a month before.
It turned out the numbers for Friday, Sep. 4th were wrong. After months of collecting and reporting daily totals, DHS and its partners bungled the counts for the entire week and were trying to catch up.
“The negative and positive case numbers look higher today due to problems with the laboratory test reporting that have now been fixed.” DHS explained on Twitter.
The Journal Sentinel additionally reported that “some test results from Monday evening through Wednesday morning weren’t processed until Thursday.”
If true, only two days’ worth of results should have been impacted by that error: Tuesday’s and Wednesday’s. According to DHS, 11,844 test results were recorded on Tuesday, September 1st, the highest so far in September. There were only 11,702 results on Friday, complicating the official narrative that it was a catch-up day.
In any case, DHS maintains that the public should not pay much attention to the daily updates anyway.
“Remember to look at 7-day trends to get the full picture of how the state is doing,” DHS said on Twitter.
However, despite that advice, DHS continues to rely on daily updates to measure Wisconsin’s COVID-19 activity level, which drives the Evers Administrations’ public health strategies.
Daily Data Decisions
In April, Gov. Evers launched the Badger Bounce Back program to define the conditions under which he would allow Wisconsin’s economy to reopen. Six gating requirements will indicate when those conditions are met.
The gating requirements include: 1) Downward trajectory of flu-like illnesses over 14 days, 2) downward trajectory of COVID-like syndromic cases over 14 days, 3) downward trajectory of positive cases as a percent of total tests within a 14 day period, 4) 95% of hospitals affirm that they can treat all patients without crisis standards of care, 5) 95% of all hospitals affirm that they have arranged for testing for all symptomatic clinical staff treating patients at the hospital per CDC guidelines, and 6) Downward trend of COVID-19 cases among health care workers calculated weekly. Each requirement is coded either green or red. Once all six are green, the state is ready to begin reopening according to Badger Bounce Back.
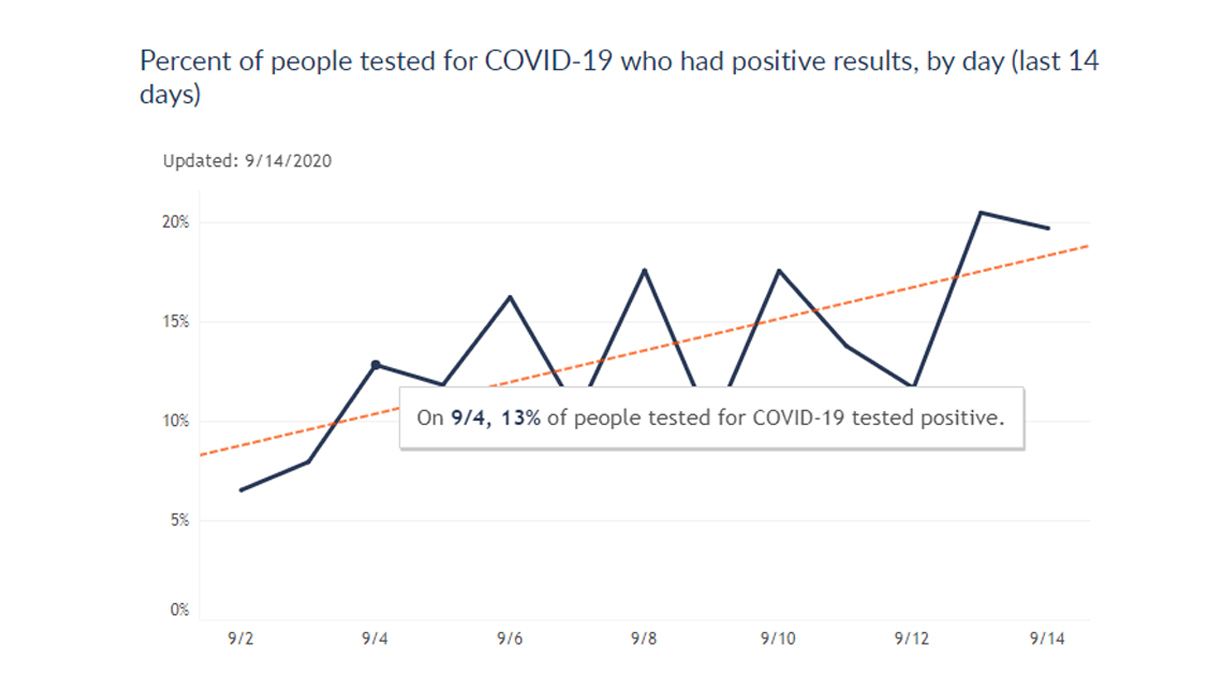
Those 14 days are not averages. They are the actual day-to-day numbers. For example, the positive test rate for September 4th was 13%. (The image above is a screen capture from the DHS dashboard confirming that was the rate recorded for that date). DHS Sec.-Designee Andrea Palm explained the system relies on a “rolling trajectory,” not rolling averages.
The gating requirements seemingly were designed specifically to keep Wisconsin closed throughout the summer. This became a moot point in May, when the Supreme Court struck down Evers’ unconstitutional orders. However, the Badger Bounce Back gating requirements are still in effect and they rely on daily data and totals.
The “Cases” indicator was the gating criterium most affected by DHS’ failure to successfully manage its data collection operations: “3) downward trajectory of positive cases as a percent of total tests within a 14-day period.”
Every day’s percentage of positive tests is the actual percentage for that day. It is not a rolling average. And so, on September 4th, the rate jumped up to 13%. The daily percentage was beginning to decline, until that new rate solidified an upward trajectory. The gating light remains red.
Weekly Data Decisions
Since Badger Bounce Back was deemed unconstitutional by the Supreme Court’s decision, DHS has introduced additional metrics to shape public health policy in Wisconsin.
In June, DHS added a local activity level dashboard to its website based on weekly data. It records each county’s case burden and trajectory of new cases. DHS then assigns each county an activity level description of low, moderate, or high.
“This data dashboard makes it possible for local leaders, businesses, and individual Wisconsinites to better understand the level of COVID-19 activity they face in their communities and to take precautions accordingly,” Sec-Designee Andrea Palm explained in a press release.
However, this system seems designed to drive local officials to the conclusion that things are not getting better. It is not known how DHS developed the thresholds for each activity level, and they are suspiciously low.
For several Wisconsin counties, just a single case every two-weeks is enough to lose their “low” activity classification. Just 1 or 2 new COVID-19 cases a day is enough for DHS to brand most Wisconsin counties with a “high” activity classification. Not surprisingly, according to DHS, nearly every county in the state has a high COVID-19 activity level.
Whether or not this system was intentionally designed to exaggerate Wisconsin’s COVID-19 levels, its purpose is at the county level.
State officials, presumably, continue to use the Badger Bounce Back metrics that are updated daily – even though that DHS has hopelessly bungled its daily data collection.