Another stunning year of improvements for choice and charter schools, while Milwaukee and Racine Unified see student growth but poor overall proficiency
November 25, 2019
By Ola Lisowski
Wisconsin schools are improving, according the Wisconsin Department of Public Instruction’s (DPI) 2019 report cards. Having examined the results as a whole, let’s focus on a few districts and schools of interest.
Milwaukee Public Schools (MPS)
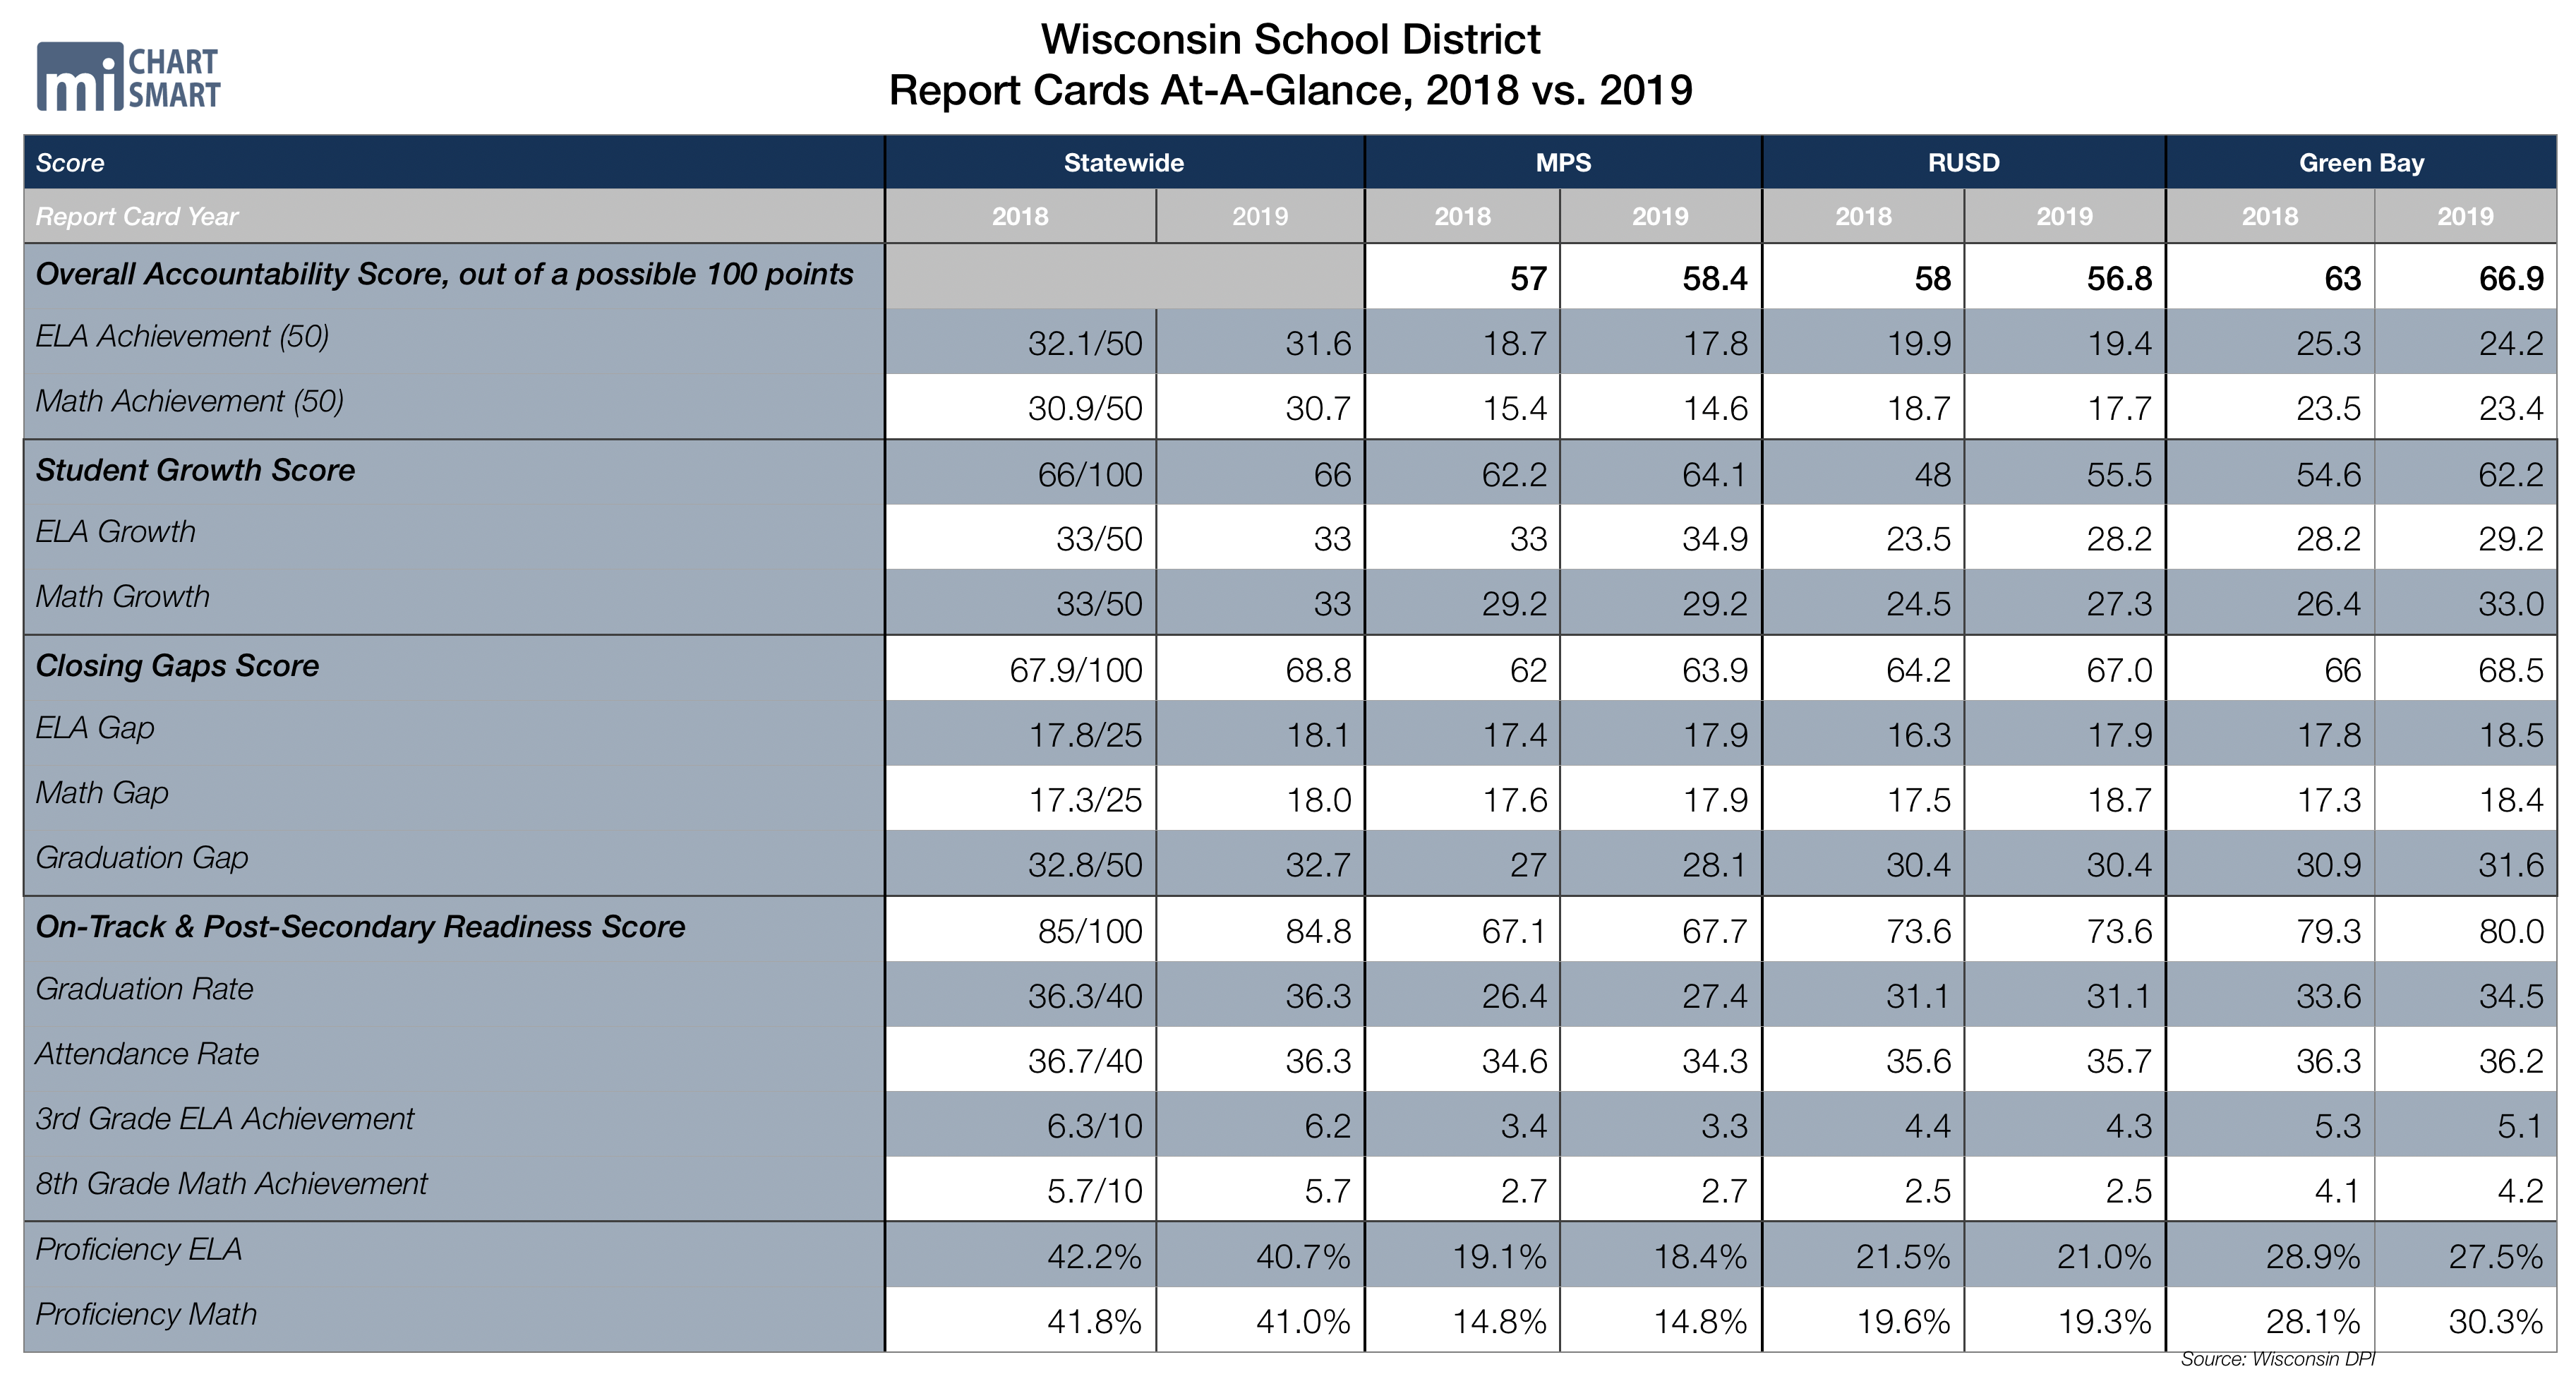
The state’s biggest school district improved by 1.4 points over last year, for a total overall score of 58.4 out of 100. That means MPS “meets few expectations,” a two-star rating.
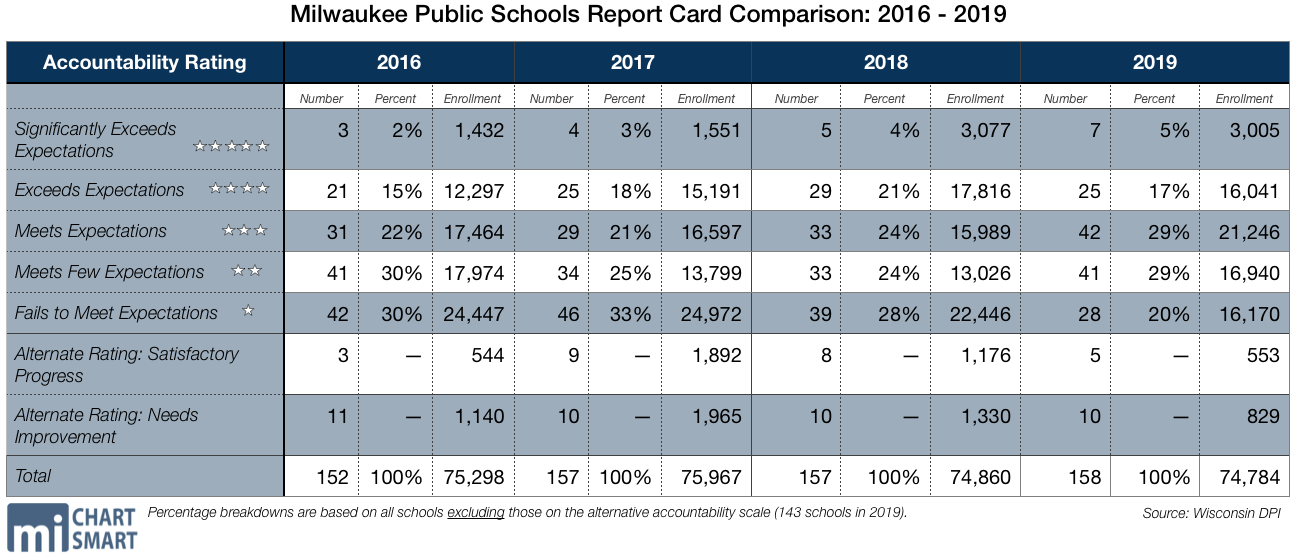
Seven out of 158 schools earned the top ranking of “significantly meets expectations” this year. In all, 3,005 students attend five-star schools at MPS this year, slightly less than last year’s total enrollment of 3,077 students across five top-ranking schools.
Excluding the 15 schools that received scores on the alternate rating scale, 5 percent of MPS schools earned the highest ranking.
The best school in the district is Pratt Elementary, where 34 percent of students are proficient in math, 26 percent are proficient in English language arts, and 97 percent of students are economically disadvantaged.
Three of the seven five-star schools at MPS are public charter schools, including Milwaukee Excellence, Carmen High School of Science and Technology (South Campus), and Milwaukee College Prep (38th Street).
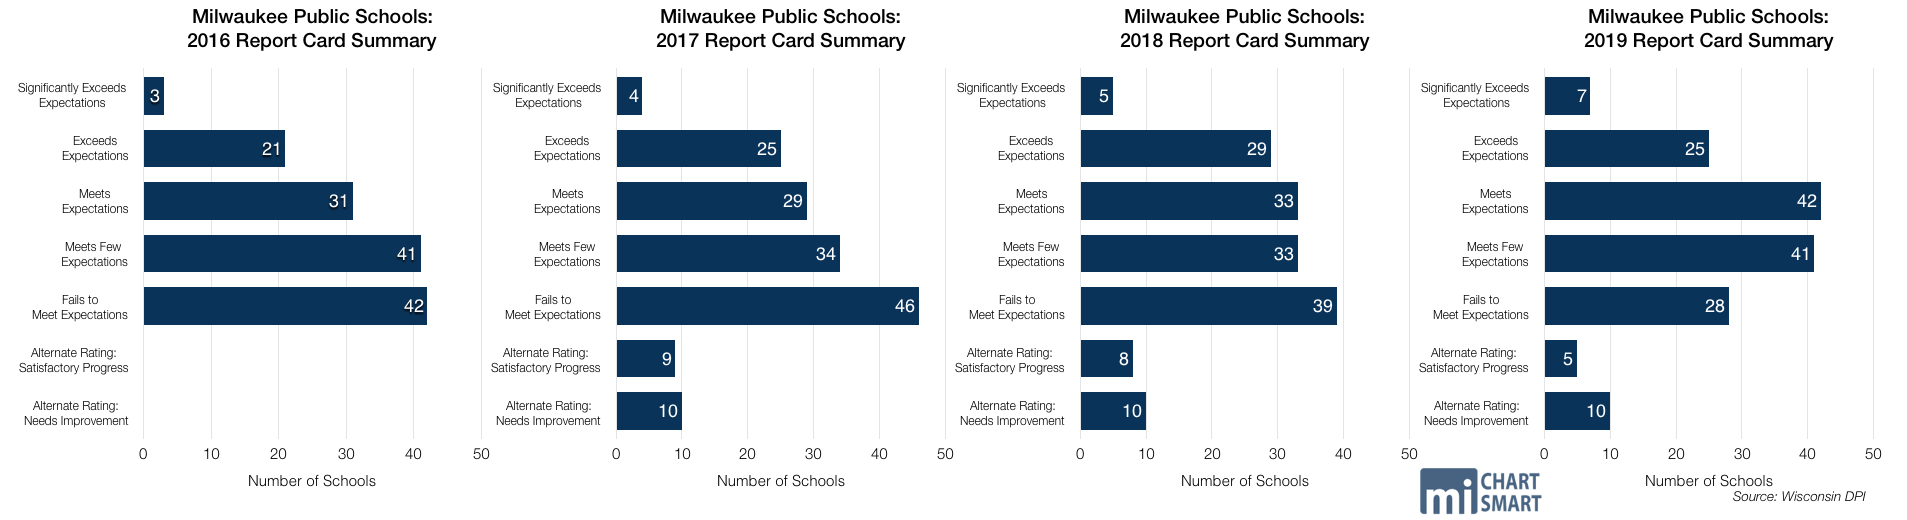
This year, 20 percent of MPS schools received failing marks—less than last year’s 28 percent. In all, 28 schools enrolling 16,170 students were ranked “failing to meet expectations.” Last year, 39 schools with total enrollment of 22,446 students received the one star ranking.
That means the number of students rolled in failing schools fell by almost 30 percent in one year. It also marks the second year in a row that fewer MPS students are attending failing schools.
That over 6,200 fewer students are attending failing schools this year is wonderful news. Still, the 16,170 students, on their own, nearly equal the entire population of Kaukauna. The district has a long way to go to adequately prepare all of its students for life after high school.
Overall proficiency scores make that clear: just 14.8 percent of MPS students are proficient in math, and 18.4 percent are proficient in English language arts.
Schools with higher levels of poverty weigh student growth more heavily than achievement. This creates a significant disconnect between actual ratings and student achievement, but it’s important to see whether or not students are improving as a key mark of their school’s effectiveness.
Audubon Technology and Communication High received the worst score in the district, a 52.7 out of 100. Just 9 percent of students are proficient in English language arts, and 3 percent are proficient in math.
At seven MPS schools, zero students are proficient in math. Of those schools, five were ranked on the alternate rating scale. The others, Andrew Douglas School and Daniels University Prep Academy, both received scores of failing to meet expectations.
Eight MPS schools, including three charter schools, showed higher proficiency in math than the state average of 41 percent.
Racine Unified School District (RUSD)
RUSD has long struggled with student success, and in 2016 was the only district to receive a failing grade. From 2017-on, the district has earned two stars, meeting few expectations. In 2019, the district has earned a total score of 56.8 out of 100, marking the third consecutive year of overall score declines.
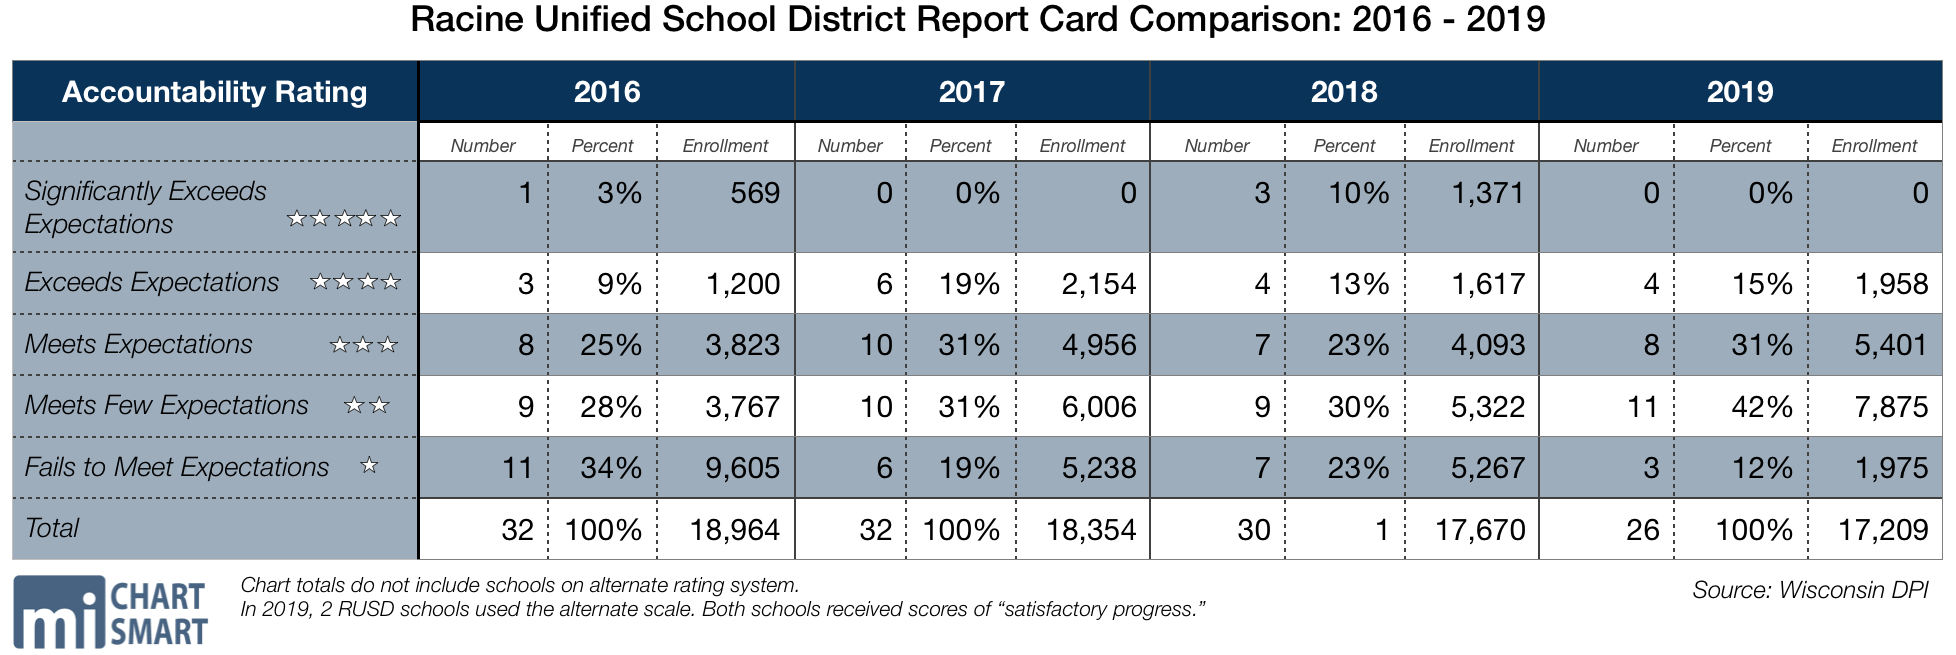
Despite a lower overall achievement score, the district has made significant gains in year-over-year student growth. This year, students earned 55.5 out of 100 points for student growth, a significant increase from last year’s 48 points in student growth. In 2016, RUSD earned 26.1 points for student growth, which means it has more than doubled its points in that category in just a few years.
All together, there are 17,209 students in 26 RUSD schools that earned scores on the ranked report card scale. Two schools used the alternate accountability scale, and both of those schools reported scores of “satisfactory progress.”
Compared to last year, the district has seen significant shifts toward the middle of the five-star scale. While three schools earned five stars last year, zero schools got the top marks this year. On the other end of the scale, seven scores with total student enrollment of 5,267 were ranked as failing last year. This year, just three RUSD schools with 1,975 students received failing scores.

Eleven RUSD schools earned two stars this year, the most in any one category. The majority of RUSD students attend one- or two-star schools. In all, 57 percent of students at RUSD attend schools ranked failing or meeting few expectations. That’s a slight decline from last year’s 59 percent.
Racine Unified continues to struggle with poverty—64 percent of students are economically disadvantaged. Janes Elementary has the highest poverty rate in the district and is a four-star school with an accountability score of 76.1. That stands in contrast with Gifford Elementary, which has the lowest poverty rate in the district and an overall score of 66.6, meeting expectations.
Parental Choice Programs
Students in private school choice programs showed significant gains again this year, with school rankings moving up. While 11 schools earned one star last year, four schools earned that ranking this year. Last year, 14 schools earned top marks, and this year, 23 received the highest five-star ranking.
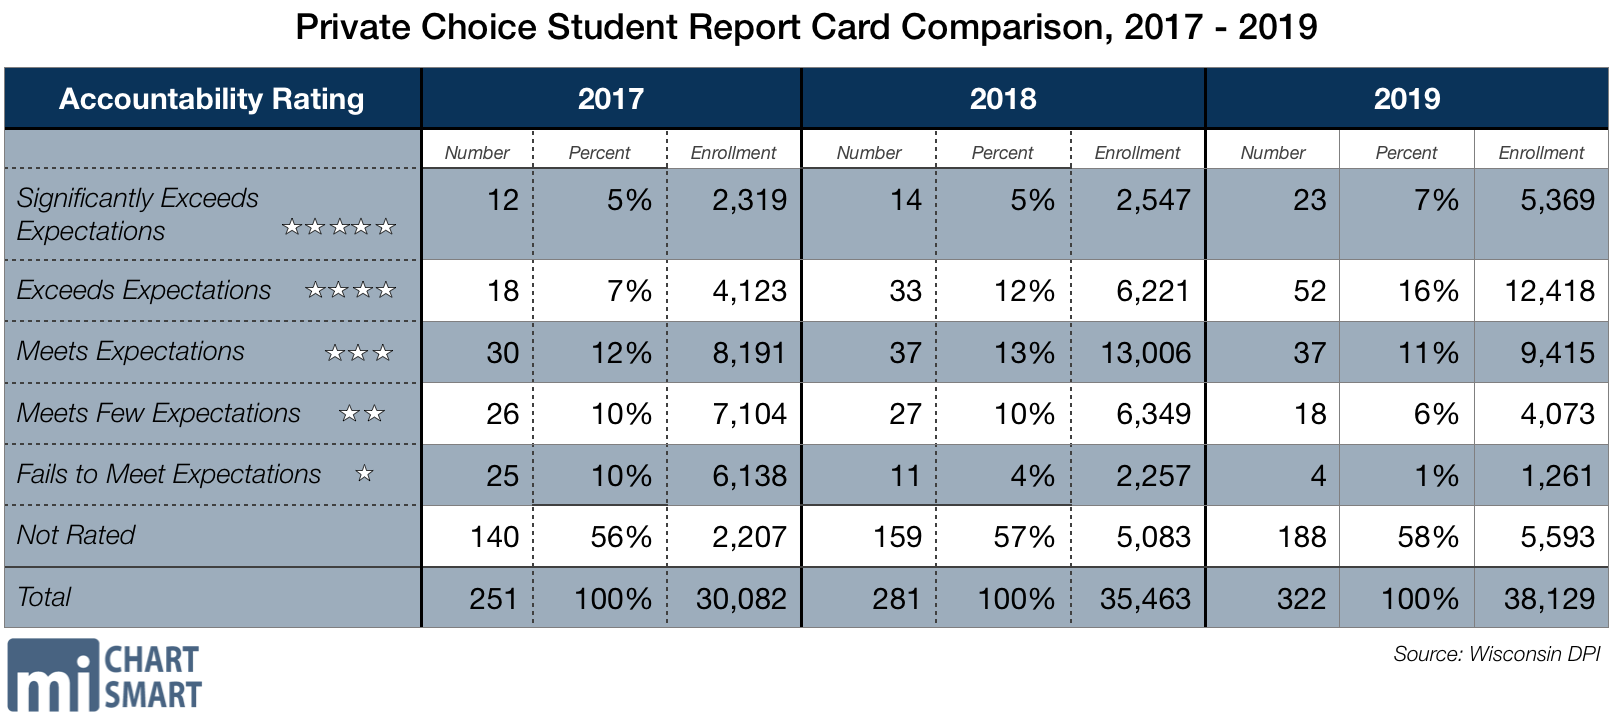
The data also reflect the impressive growth in the school choice programs. Student enrollment increased by 8 percent in one year. A total of 322 schools received report cards this year, up from last year’s 281 schools.
Still, ratings on the five-star scale requires several years of data. For that reason, 58 percent of choice schools enrolling more than 5,500 students were not rated on the five-star scale.
In all, 32,536 students attend private choice schools that received report cards on the traditional ranking scale. Approximately 16 percent of those students attend schools that received just one or two stars this year. That marks a significant improvement from the last two years. In 2018, 8,606 students attended schools with one or two stars, or 28 percent of student enrollment at ranked schools.
In 2017, 6,138 students attended 25 private choice schools with failing scores. In 2019, the number of failing schools has dwindled to four, enrolling 1,261 students. It’s a stunning decline in the number of one-star schools.

The same is true at the other end of the scale. In 2017, 12 private choice schools received five stars, and in 2018, 14 received five stars. This year, 23 private choice schools with total enrollment of 5,369 earned the top distinction.
The highest-ranked private choice school is Saint Charles Borromeo Catholic School, which earned 90.8 out of 100 points. This year, 47 percent of students at Saint Charles are proficient in math, higher than the state’s average of 41 percent. In English language arts, 57 percent of students are proficient. More than 40 percent of all students at the school are economically disadvantaged.
Milwaukee Lutheran High earned the worst score of any private choice school, with 45.5 out of 100 points. Just 5.8 percent of students are proficient in math, and 8.9 percent are proficient in English language arts. Sixty percent of the students are economically disadvantaged.
This year, private choice schools are the shining stars of the report cards. We hope to see this positive trend continue.
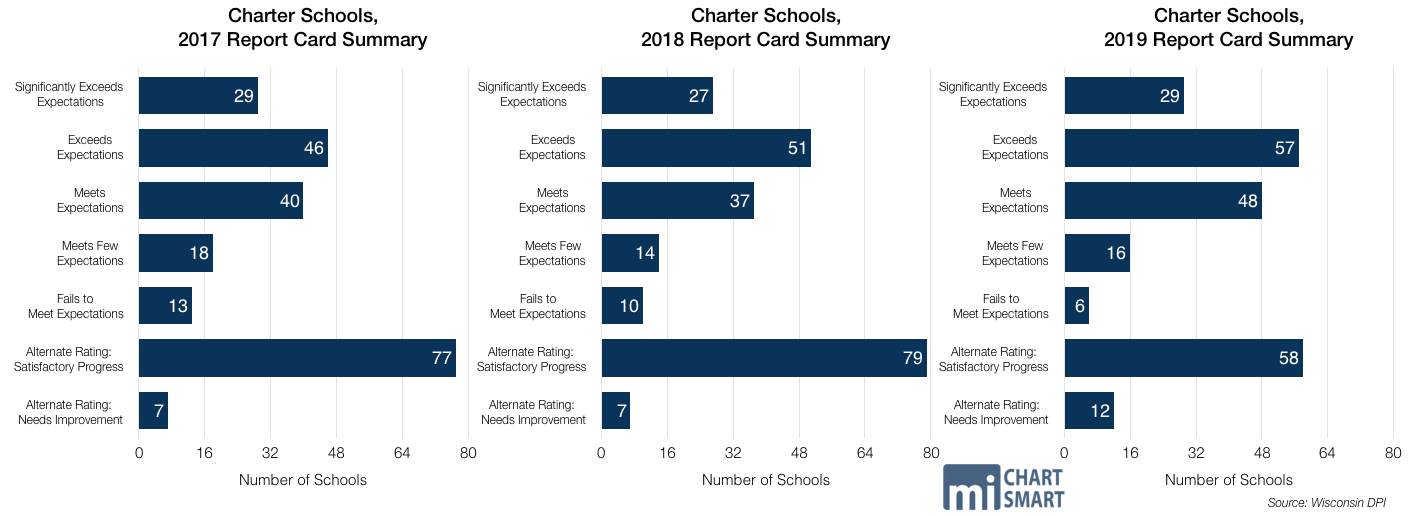
Charter Schools
Charter schools also improved compared to last year, with schools generally shifting toward the higher end of the scale. Out of 226 charter schools, 156 earned report cards on the five-star scale this year.
Of the 156 schools with ranked report cards, 29 earned five stars, an improvement from last year’s 27 schools. With 57 charter schools receiving four stars, the majority of charter schools are in the exceeding expectations category.
Last year, ten charter schools with total enrollment of 3,488 students earned failing marks. Now, just six schools enrolling 1,930 students have one star. That decline is even more impressive when you consider 2017’s report cards, which scored as failing 13 schools enrolling a total of 4,791 students.
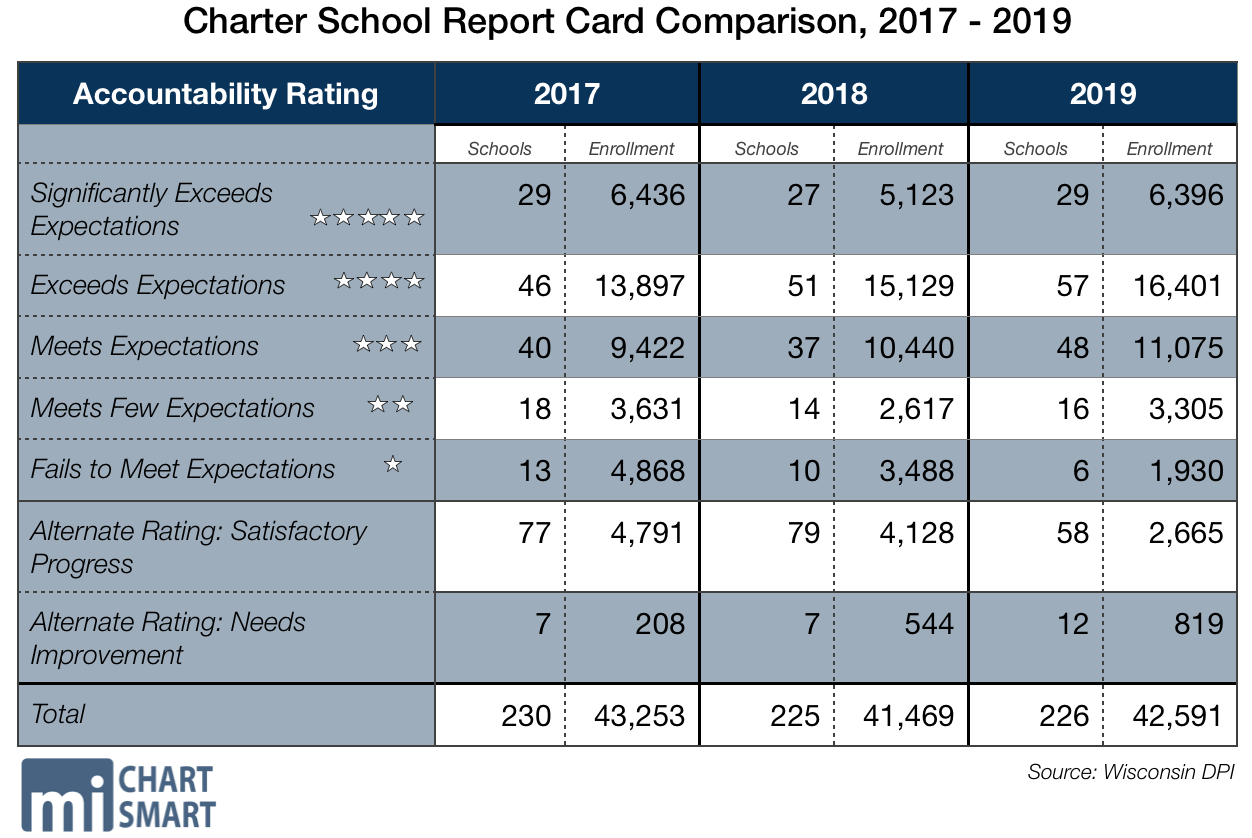
The vast majority of charter schools are public schools, so they also appear in district report cards. As we mentioned above, seven MPS schools earned five stars this year. Three of those schools are charters – 43 percent of all MPS five-star schools.
On the other end of the scale, 28 MPS schools earned one star. Only one of those schools is a charter school, or 4 percent of the failing category. Of the 41 MPS schools with two stars, one is a charter.
The data reflect that public charter schools tend to perform better than traditional public schools.
The best-performing charter school in the state is the Accelerated Advanced Learning Program in Oshkosh, which received 97 out of 100 points. It is the fifth-highest scoring school in the state, with 95 percent of students proficient in math and 92 percent proficient in English language arts.
The worst-performing charter school in the state is Saint Croix Academy of Virtual Education, which received 42 out of 100 points. The school received the 11th-worst score of any school in the state, with 12 percent of students proficient in math and 26 percent proficient in English language arts.
Another charter school with just one star, Daniels University Prep Academy in Milwaukee, has zero students proficient in math. Just 2.7 percent of students are proficient in English language arts.
Key Takeaways
The re-introduction of school and district report cards has been a net positive for public transparency. With four years of data using the current report card formula, schools now have a solid set of metrics from which to learn.
Still, the disconnect between overall points and student proficiency is shocking. While results are generally positive this year with more schools improved in the rankings, 20 schools have zero students who are proficient in math. At 14 schools, zero students are proficient in English language arts. There are also many schools with total proficiency that rounds to zero. A total of 54 schools have 1 percent or fewer students proficient in math. That figure undoubtedly needs more attention in the public debate about student achievement.
To find proficiency numbers, download the full excel spreadsheets provided by DPI to find out where your school and district stand.
This year’s report card release also shows that critics of private school choice have increasingly little data backing them up. The number of students in failing private schools has plummeted from 6,138 to 1,261 from 2017 to 2019, and the number of students in five-star private choice schools has more than doubled.
We encourage everyone to examine student proficiency in math and English language arts, in addition to reading about their school and district rankings.