For the first time since 2017, a district has been marked “failing.” Yet compared to last year, the number of failing schools fell by nearly half.
November 13, 2019
By Ola Lisowski
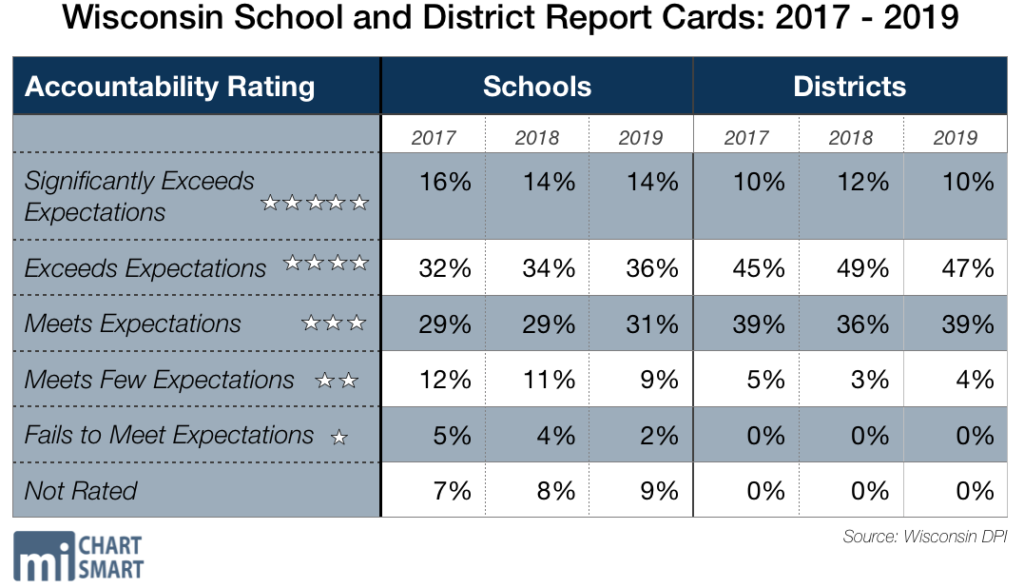
Wisconsin schools are improving, according to the Department of Public Instruction’s (DPI) annual report cards released Tuesday. At the same time, district performance is trending downward, with more districts earning three-star and two-star results compared to last year.
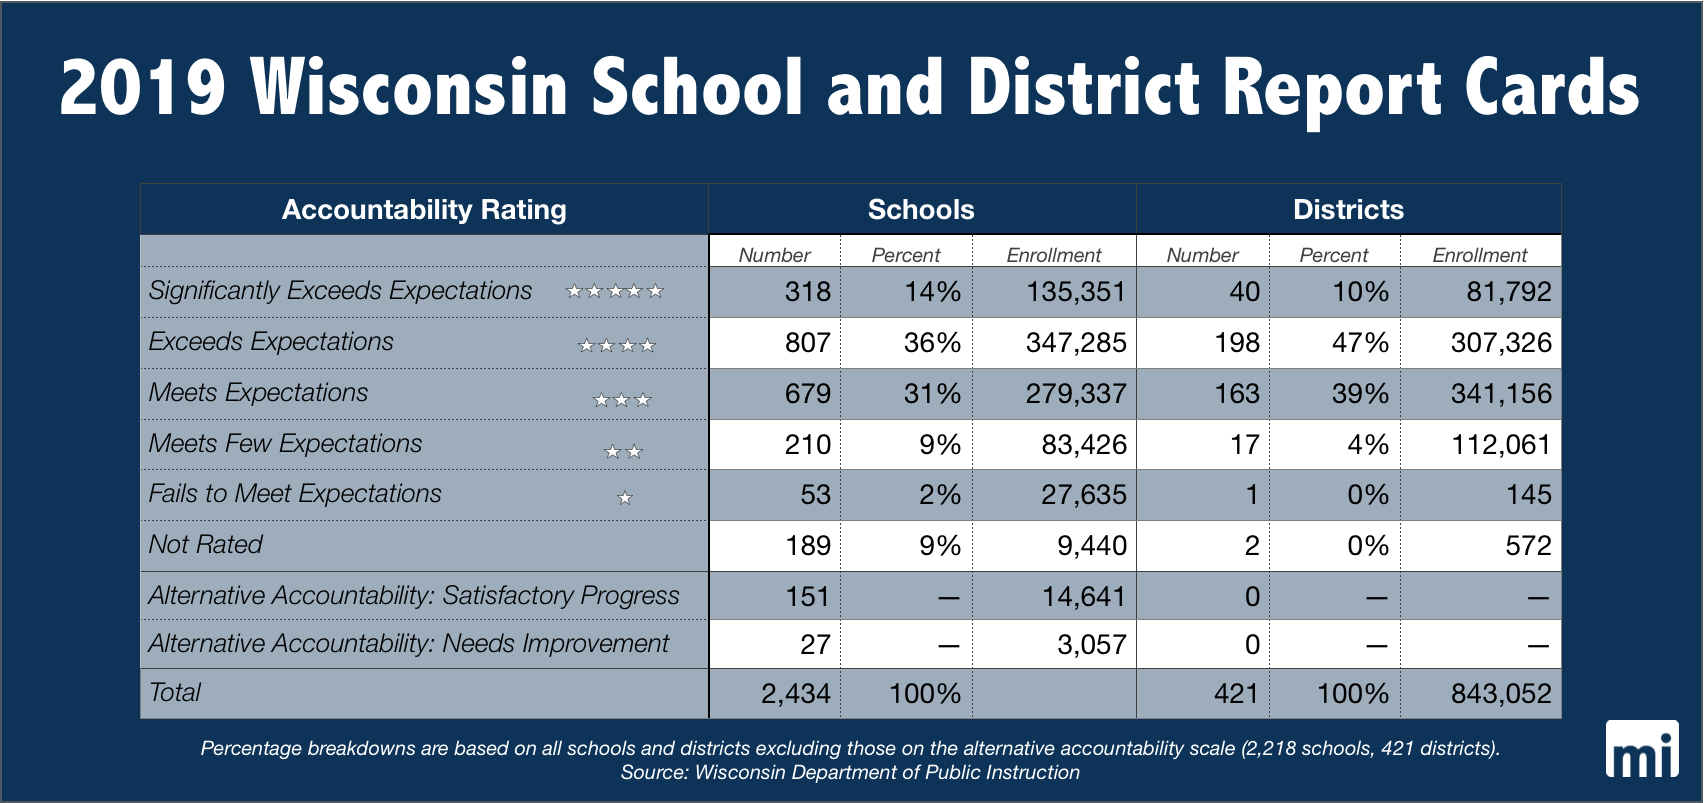
Most schools and districts are scored on a 0-100, five-star scale, from “fails to meet expectations” to “significantly exceeds expectations.” A small percentage of districts and schools use alternative accountability measures, receiving scores of either “satisfactory progress” or “needs improvement.” Approximately 9 percent of schools were not rated because of insufficient data.
Compared to 2018, more schools trended upwards, especially at the lowest end of the rankings.
Districts and schools with one star “fail to meet expectations.” Only one district, Mercer School District in Iron County, received one star this year. For the last two years, no districts have earned one star.
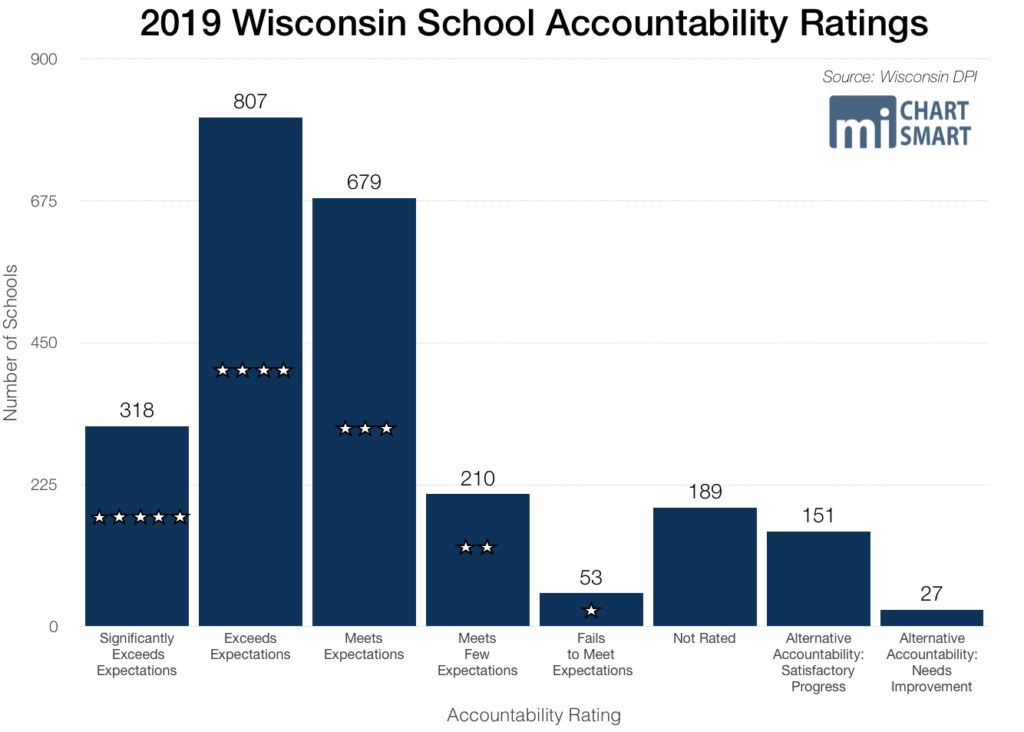
Significantly fewer schools earned failing marks this year. Overall, 53 schools with a combined enrollment of 27,635 students were considered failing. Last year, 95 schools with total enrollment of 40,919 students got one star.
Two-star districts and schools “meet few expectations.” This year, 17 districts earned two stars, including Milwaukee Public Schools (MPS) and Racine Unified School District (RUSD). Last year, 14 districts received two stars.
This year, 210 schools met few expectations, down from last year’s 249. 
Three-star districts and schools “meet expectations.” This year, 163 districts earned three stars, up from last year’s 152.
For 2019, 679 schools earned three stars, more than 2018’s 671 three-star schools.
Four-star districts and schools “exceed expectations.” The majority of school districts, 198, fell into this category. Last year, 206 districts earned four stars.
More schools fell into the four-star category than any other, with 807 schools exceeding expectations. That’s more than last year’s 768 schools.
Finally, five-star districts and schools “significantly exceed expectations.” In all, 40 school districts earned top marks, down from last year’s 49.
A total of 318 schools earned five stars, down from last year’s 327 schools. However, more large schools fell into the category, as total enrollment in five-star schools increased from 123,073 to 135,351.
Mercer School District received the lowest overall score in the state for the second year in a row, with 50.4 out of 100 total points. The district earned two stars last year, with a total score of 55.9 of 100. Just 145 students attend the district.
Arrowhead UHS School District earned the highest district score in the state, with 89.7 out of 100 points.
At 27.4 out of 100 points, North Division High School at MPS had the worst school score in the state. Just 1.9 percent of students at North Division are proficient in math, and 1.0 percent are proficient in English language arts.
Milton Consolidated Elementary School had the highest score of any school with 99.2 out of 100 points. This year, 85.7 percent of students were proficient in math and 81 percent were proficient in English language arts.
Report card scores are based upon a calculation of four priority areas: student achievement, school growth, closing gaps between student groups, and metrics measuring postsecondary readiness. Districts with larger percentages of impoverished students receive heavier weights for year-over-year growth rather than overall achievement.
The report cards also deduct points for high levels of student absenteeism and drop out rates. This year, 153 school report cards lost points for absenteeism higher than 13 percent. Last year, 125 schools had high absenteeism.
This is the fourth year that private schools in the Milwaukee, Racine, and statewide parental choice programs received report cards. Overall, 322 private choice schools and 2,112 public schools received report cards. All of the schools that were not rated were private choice schools with insufficient data for report cards.