No Consistency On Way Road Conditions Are Reported
The Feds, the State and local governments use different reporting methodologies

MacIver News Service | March 6, 2017
By Bill Osmulski
Talking about roads is like talking about the weather – people never get tired of the topic and everyone has their own opinions. Apparently, even for the pros, the state of Wisconsin’s roads lies in the eye of the beholder.
For example, when the Department of Transportation announced last year that 91 percent of local roads in the state were in fair or better condition, the Counties Association said there was no way.

“Unfortunately, this analysis is, at best, a poor interpretation of the data that is provided to WisDOT or at worst, just wrong,” according to a WCA press release at the time.
Of course, there is reason to be skeptical of what WISDOT or anyone else says about the condition of Wisconsin’s roads. There are three different methods used to assess pavement conditions, and they all yield different results.
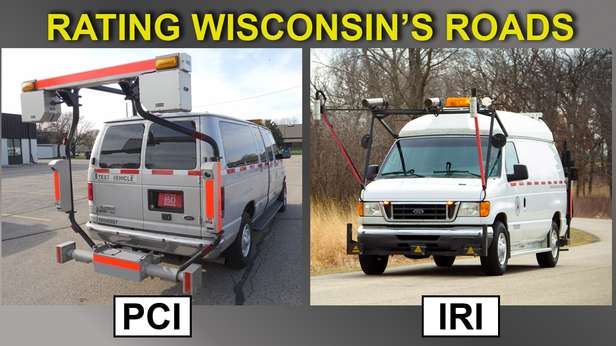
The DOT uses the International Roughness Index (IRI) to determine how smooth roads are, which is required for federal reports. It also uses the Pavement Condition Index (PCI) to determine the overall integrity of roads, which relies on an individual engineer’s personal assessment of photographed cracks on the surface. Then there are local units of government, which required to collect data on local roads. Most use a system similar to PCI called PACER. The DOT says PACER data cannot be used together with PCI, because they use different measurement scales. All these methods require different equipment for collection.
“There’s kind of been multiple sides in the discussion on the condition, the funding, and the management of the system. I think regardless of where you come down on this, I think there are bullet points or there’s some meat in here for you,” Rep. John Nygren stated at the public hearing on the DOT audit.
“How can we really understand the true condition if we can use different scales? My fear is with different measures, it appears as if it makes it easier to craft a message,” Senator Chris Kapenga (R-Pewaukee) later said at that same hearing.
Abundant road condition data leaves plenty of room for interpretation. pic.twitter.com/79iDuvg66N
— MacIver News Service (@NewsMacIver) March 3, 2017
Kapenga and Nygren are correct in their assessment. Within the DOT audit there were three different sets of results for road conditions in 2014. The IRI results indicate 32 percent of the state’s roads are in good condition. According to CPI, 64 percent of backbone highways are in good condition and 40 percent of non-backbone highways are in good condition. Using those three sets of results, you could also say either about 1 percent or 9 percent or 17 percent of Wisconsin roads are in not acceptable, poor or worse condition.
Then there’s always the statistics game, where you can pick and combine different categories. By combining the IRI’s results for Good and Acceptable roads, you could say 91 percent of Wisconsin roads are in fine shape. That’s what the DOT was able to do in the example above.
When MacIver News wanted to take a closer look at the IRI data and see how the results change over time, the DOT provided the link to a Federal Highway Administration (FHWA) report. Now in the audit, there were three categories for IRI: Good, Acceptable, and Not Acceptable. In the FHWA report, there are eight different ranges: <60, 60-94, 95-119, 120-144, 145-170, 171-194, 195-220, and >220. Also, roads fall into one of eight different types: interstate rural, other freeways and expressways rural, other principal arterial rural, minor arterial rural, interstate urban, other freeways and expressways urban, other principal arterial urban, and minor arterial urban. MNS asked the DOT, how was all this official data condensed into the one neat table broken into good, acceptable and not acceptable roads? The DOT did not respond.
There are reasons for the different rating systems. IRI is the most objective and easiest method to employ. PCI provides the most data, but it is expensive, subjective, and time consuming. PCI is mostly used by local governments across the country, because it makes sense on that scale. The Federal Highway Administration requires states to report using the IRI data, because CPI data collection is so inconsistent from state to state. It learned this when conducting a study on I-90 in 2012 and compared data from South Dakota, Minnesota, and Wisconsin.
Most states only collect IRI because they have to, and many consider CPI to be too impractical to collect on a statewide level. Wisconsin, however, believes that CPI is invaluable in decision making, and so the state collects the IRI for the feds and CPI for the state.
During the Audit hearing, one of the auditors related what DOT officials have been telling him for years “You can have a bumpy road, but the underlying quality of the road could be very good. A bumpy road doesn’t necessary mean the DOT would have to initiate rehabilitation or major highway work to fix it. So that’s why DOT has moved to that Pavement Condition Index that involves high resolution photography and an experienced DOT engineer looking at the condition of the road, and not only saying how many cracks does this road segment have, but what types of cracks… because different cracks mean different things.”
If you were to ask the DOT, these measures show road conditions are getting better all the time. In fact, according to a January 2017 DOT report, 97.6 percent of state (backbone) highways and 78.8 percent Non-backbone highway were in fair or better condition.
This month, the Joint Committee on Finance starts its work on the 2017-19 budget, and transportation funding will likely be the most contentious issue it addresses. With so much room for interpretation, pavement conditions will be a focal point for both sides hoping to bolster their arguments. And in the end, the final determination will be – how many potholes did you hit on your drive home?