Milwaukee Public Schools, the state’s largest district, falls off the list of failing districts while one-third of its schools are still considered to be failing
MacIver News Service | November 17, 2016
The report cards, based on the 2015-16 school year, are the first statewide accountability ratings since 2014.
In a move that was heavily hinted at by State Superintendent Tony Evers and others, Milwaukee Public Schools (MPS) is no longer ranked as failing. On the 2013-14 report cards, MPS was the sole failing district. As of today, failing school districts include Racine United, Cassville, Cambria-Friesland, Menominee Indian, and Bayfield. Nearly 20,000 students are enrolled at Racine United, which is the fifth largest district in the state. The other failing districts all instruct fewer than 1000 students each.
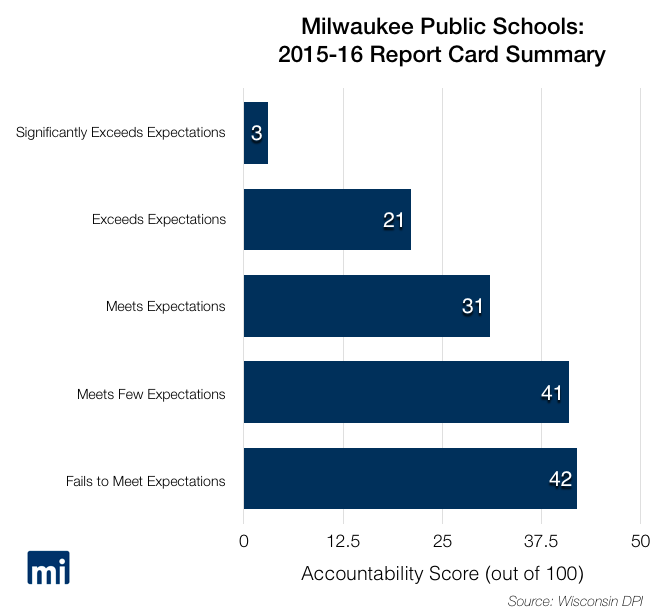
Within MPS, persistent problems still exist. While the district itself is no longer ranked as failing, one third of schools within MPS are designated as failing. The student enrollment in those 42 schools totals nearly 25,000.
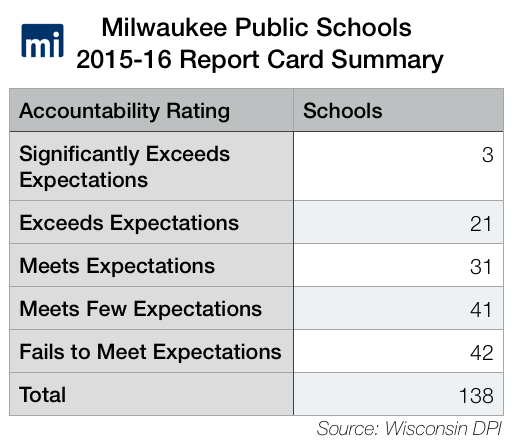
On the last report cards, when MPS as a district was ranked failing, 47 schools – an enrollment of 28,000 students – were failing. Today, one third of schools also meet few expectations. The enrollment at the 41 MPS schools meeting few expectations totals nearly 18,000 students. Twenty-two percent of schools meet expectations and 15 percent exceed expectations. Just three schools within MPS significantly exceed expectations.
DPI officials have warned the public not to compare school or district rankings on these report cards to the previous report cards, released in 2014 for the 2013-14 school year. Since the last accountability ratings were released, state officials changed the criteria by which schools and districts are judged. Poverty rates are now much more heavily considered than they were in the past, since some argue that high poverty rates typically have a correlation to low student achievement. The report cards also factor student progress rather than just overall achievement.
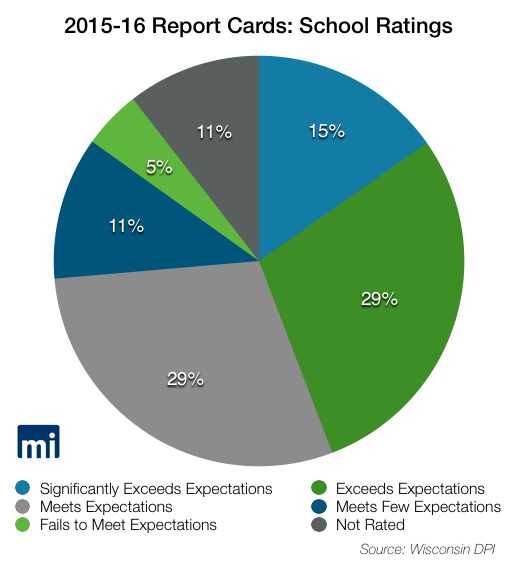
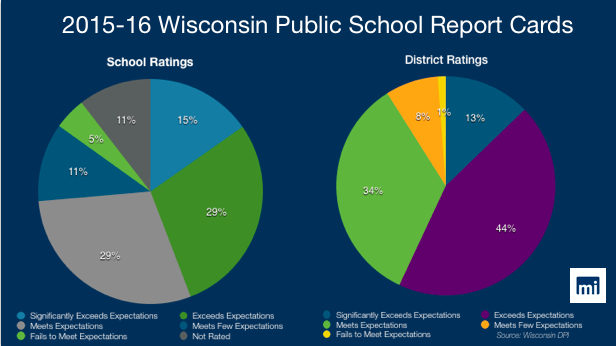
Statewide, fifteen percent of schools earned the top score – significantly exceeding expectations.
Twenty-nine percent are ranked as exceeding expectations, while another 29 percent earn the meeting expectations score. Eleven percent of schools meet few expectations and only five percent are ranked as failing to meet expectations. Eight percent of schools are ranked by an alternative accountability scale, and of those, 12 percent are said to need improvement. The 227 schools participating in the three choice programs are not rated.
MacIver News Service will continue to update this story with reaction and further analysis.